Free Access
Fig. 5.
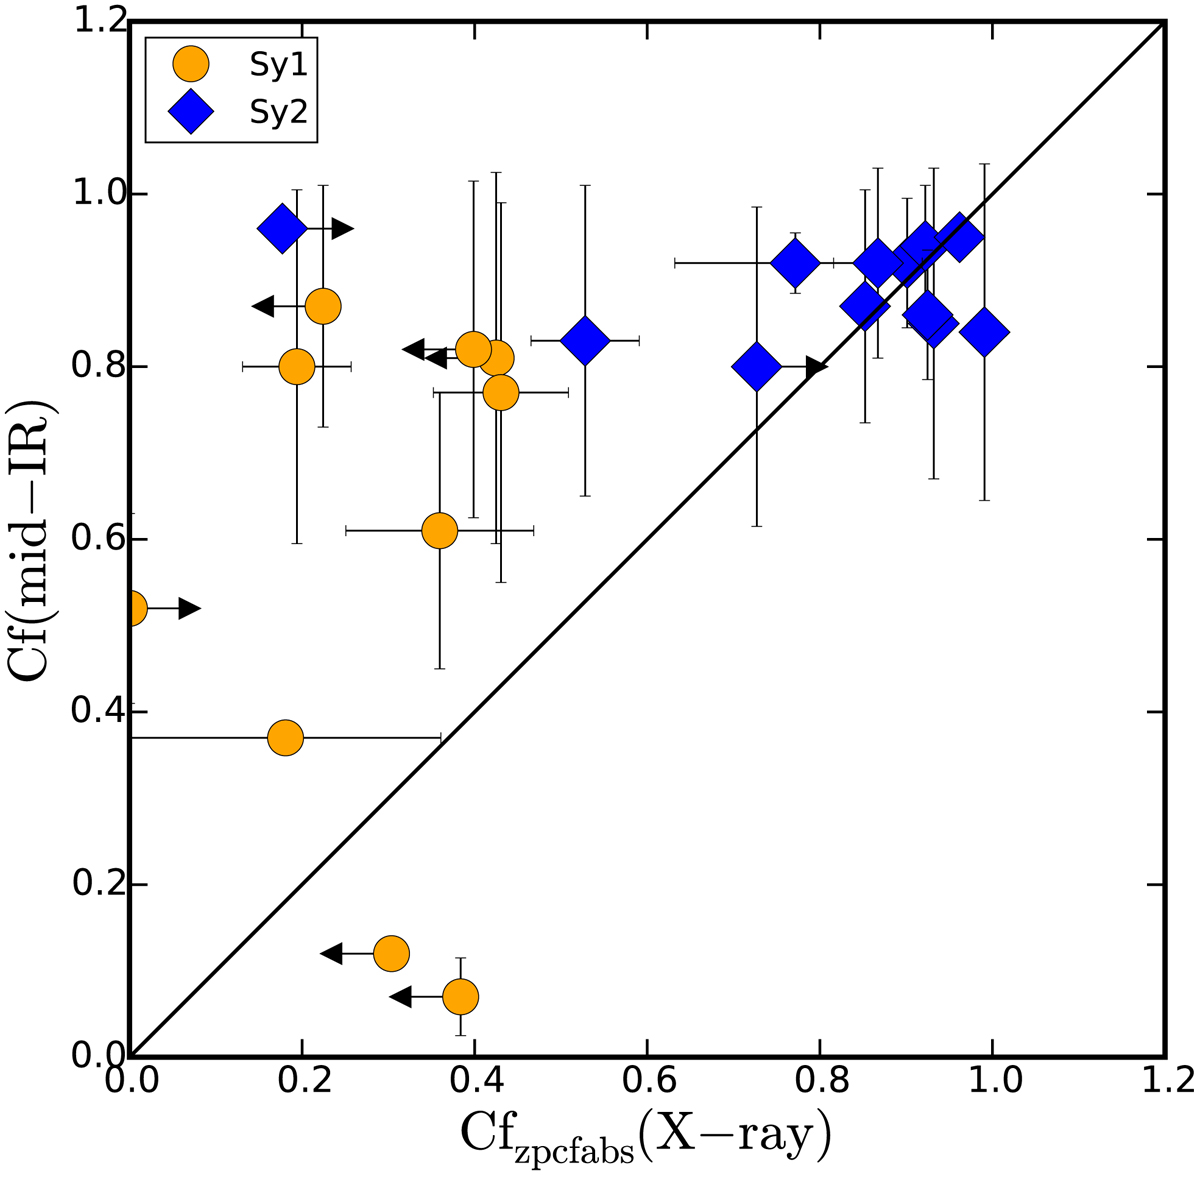
Relationship between covering factors. The Sy1 and Sy2 are shown as dots and diamonds, respectively. The solid line shows the one-to-one relationship. The X-ray covering factor is obtained throughout the partial covering.
Current usage metrics show cumulative count of Article Views (full-text article views including HTML views, PDF and ePub downloads, according to the available data) and Abstracts Views on Vision4Press platform.
Data correspond to usage on the plateform after 2015. The current usage metrics is available 48-96 hours after online publication and is updated daily on week days.
Initial download of the metrics may take a while.