Fig. 3.
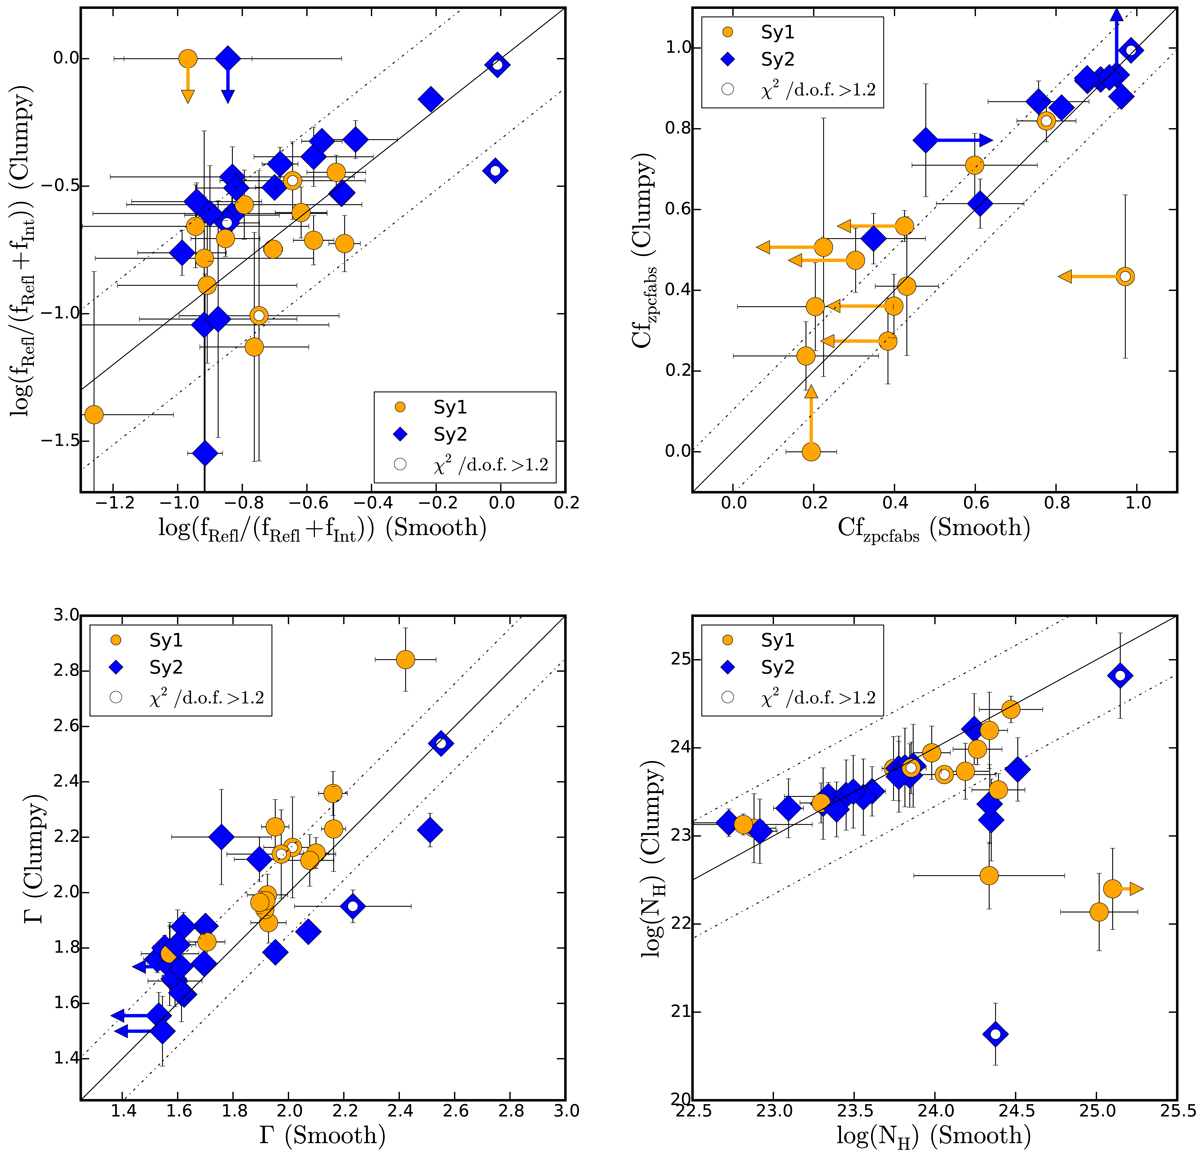
Top-left: fraction of the flux accounted for the reflection component relative to the total flux for the clumpy versus smooth baseline models. Top-right: covering factors (i.e., ratio between the scattered and intrinsic emission, Cf) from the clumpy versus smooth baseline models. Bottom-left: photon index (Γ) using the clumpy baseline model versus that using the smooth baseline model. Bottom-right: column densities (NH) using the clumpy baseline model versus that using the smooth baseline models. The Sy1 and Sy2 are shown as orange dots and blue diamonds, respectively. Arrows indicate lower and upper limits. The solid and dotted lines show the one-to-one relationship and 2σ dispersion according to the error bars of the data, respectively. The error bars were calculated through the propagation uncertainty method (see text).
Current usage metrics show cumulative count of Article Views (full-text article views including HTML views, PDF and ePub downloads, according to the available data) and Abstracts Views on Vision4Press platform.
Data correspond to usage on the plateform after 2015. The current usage metrics is available 48-96 hours after online publication and is updated daily on week days.
Initial download of the metrics may take a while.