Fig. 3.
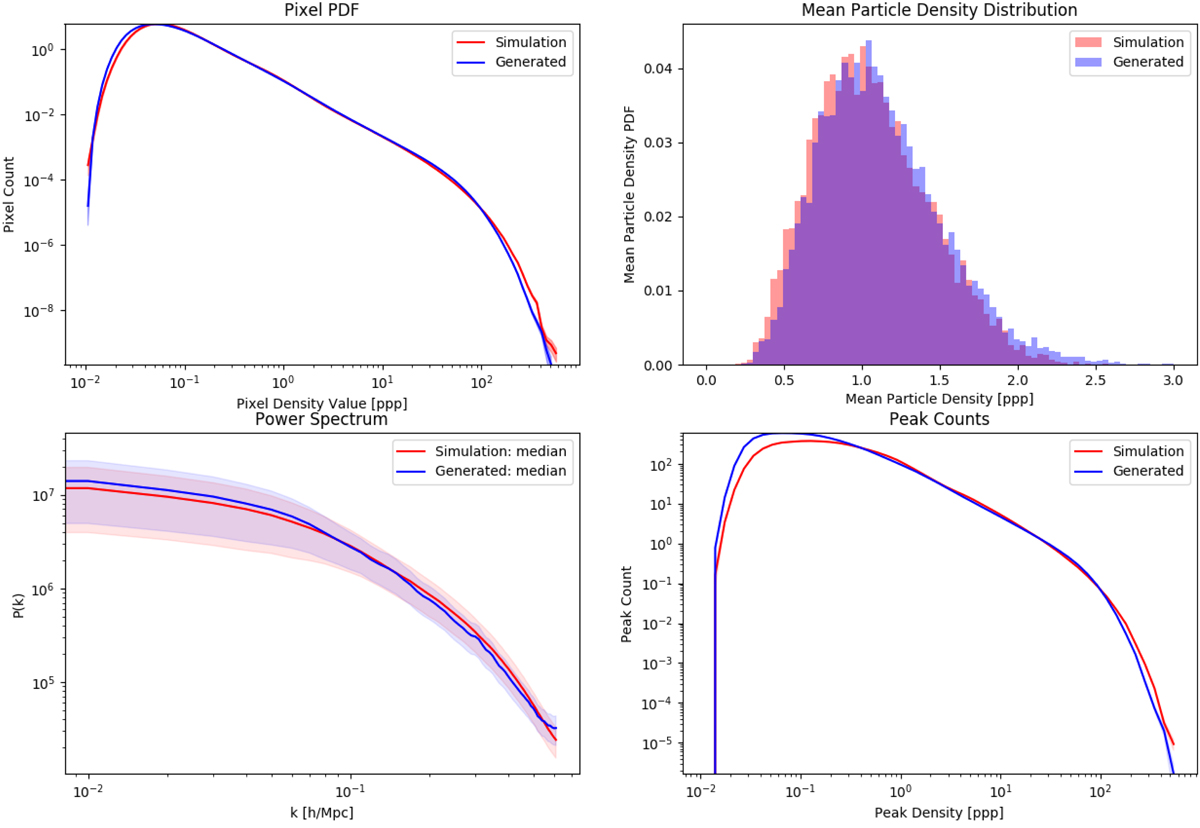
Statistics of the 2D simulation images compared to their GAN-generated counterparts. The upper left panel shows the pixel PDF, the upper right panel shows the mean density distribution, the lower left panel shows the median power spectrum as well as the median absolute deviation (mad) layer, and the lower right panel shows the average peak count per image. The curves overlap almost perfectly.
Current usage metrics show cumulative count of Article Views (full-text article views including HTML views, PDF and ePub downloads, according to the available data) and Abstracts Views on Vision4Press platform.
Data correspond to usage on the plateform after 2015. The current usage metrics is available 48-96 hours after online publication and is updated daily on week days.
Initial download of the metrics may take a while.