Fig. 13.
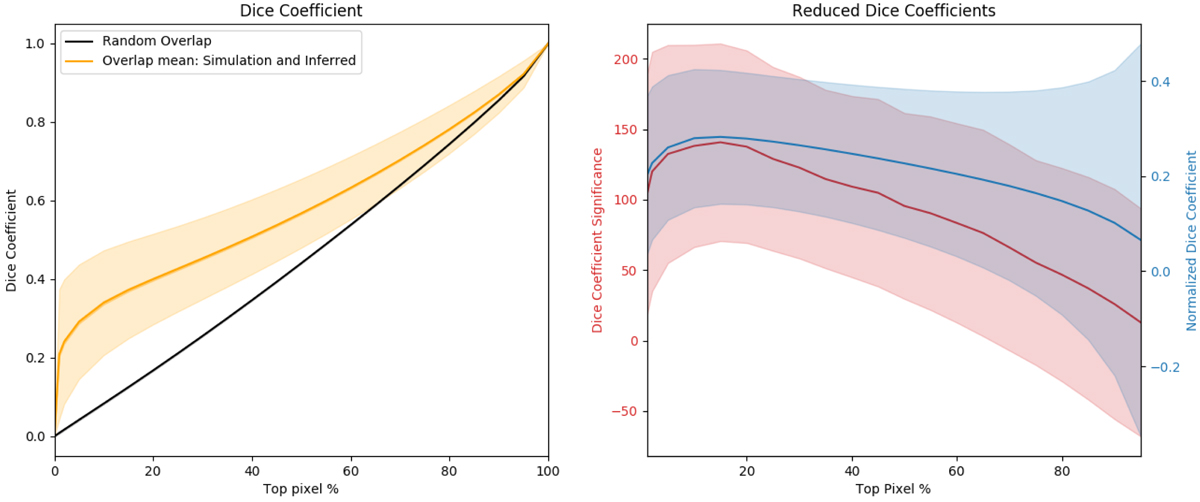
Left: dice coefficient (as defined by Eq. (9)) of the top n% voxels between the 3D simulation cubes and their inferred counterparts in increments of 5% (yellow). The inner dark yellow layer represents the measure uncertainty, and the outer yellow layer represents the standard deviation over the set. The random overlap is represented in black. Right, red: dice coefficient significance (see Eq. (11)). Blue: Normalized Dice coefficient (see Eq. (10)). The coefficients are represented with their standard deviation layers.
Current usage metrics show cumulative count of Article Views (full-text article views including HTML views, PDF and ePub downloads, according to the available data) and Abstracts Views on Vision4Press platform.
Data correspond to usage on the plateform after 2015. The current usage metrics is available 48-96 hours after online publication and is updated daily on week days.
Initial download of the metrics may take a while.