Fig. 1.
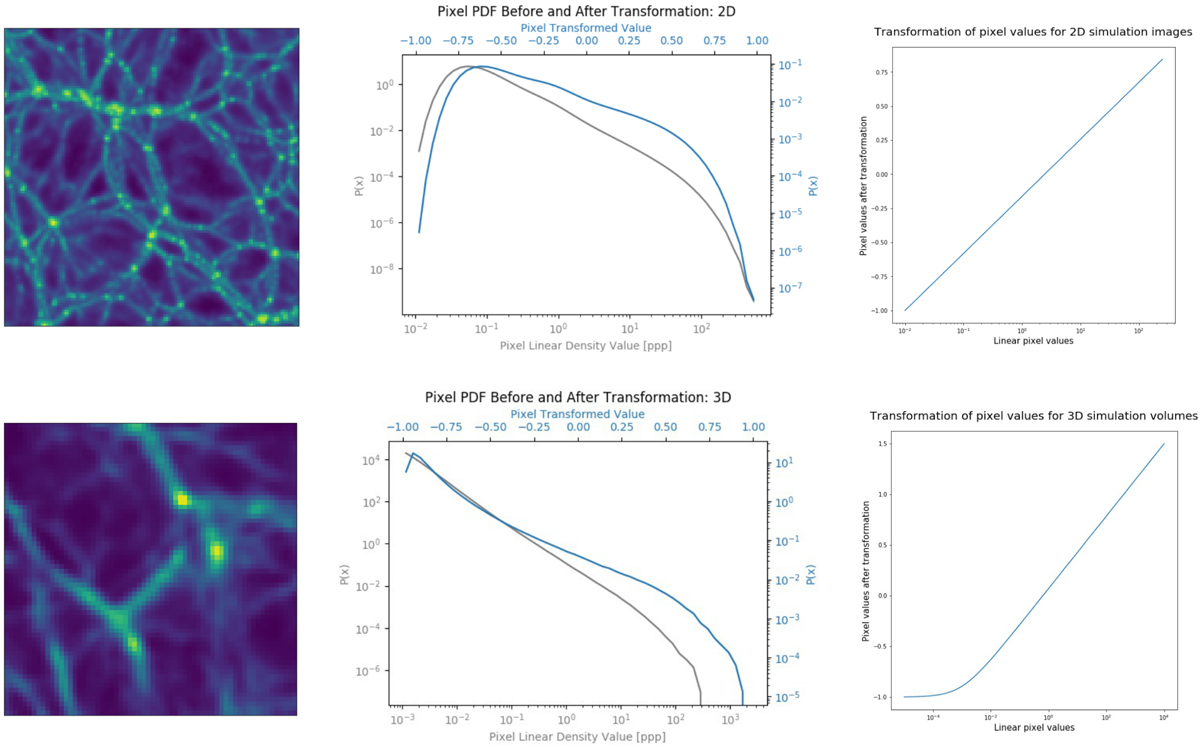
Example of a simulation image (upper left) or cube slice of thickness ≈0.4 Mpc (lower left), histogram of the pixel values before and after log-like transformation (middle), and pixel value transformation function (right) for the images (top) and cubes (bottom). In the middle column, gray represents the pixel value histogram in linear scale, and blue shows the pixel value histogram after log-like transformation (Eq. (1) at the top and Eq. (2) at the bottom) of the images. For both cases, the GAN has been trained using the log-transformed sets of images.
Current usage metrics show cumulative count of Article Views (full-text article views including HTML views, PDF and ePub downloads, according to the available data) and Abstracts Views on Vision4Press platform.
Data correspond to usage on the plateform after 2015. The current usage metrics is available 48-96 hours after online publication and is updated daily on week days.
Initial download of the metrics may take a while.