Open Access
Fig. 5.
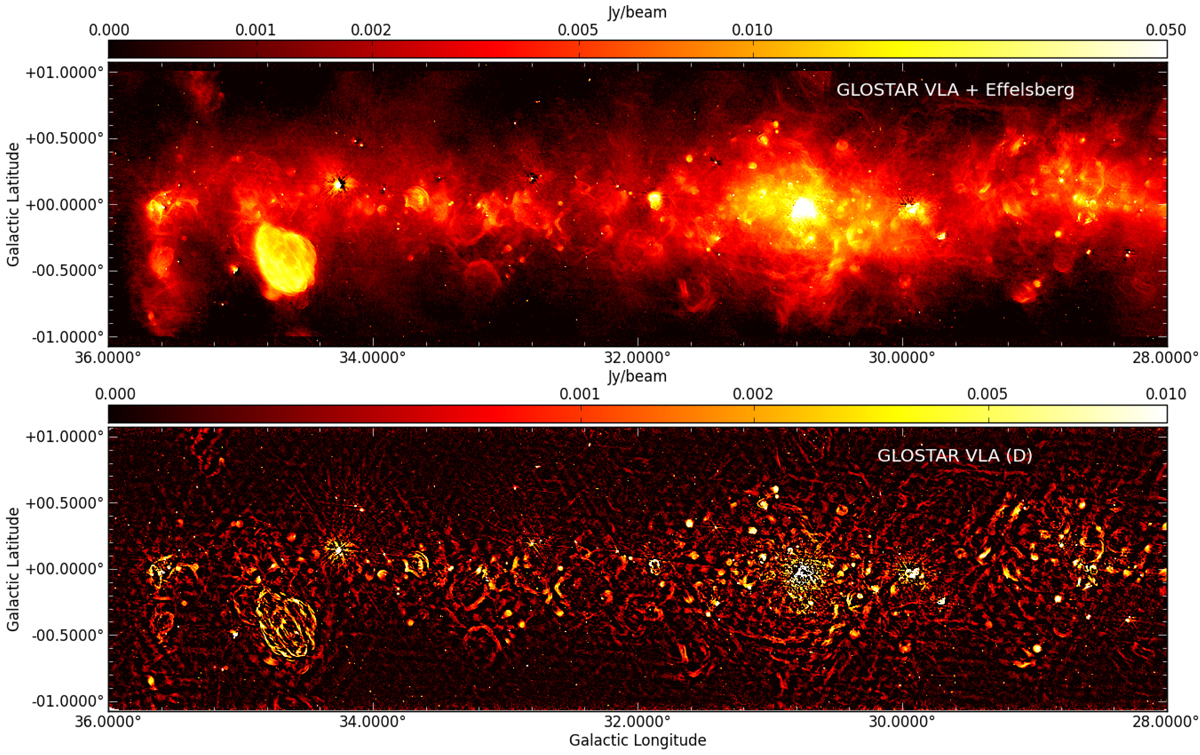
Radio continuum image of the pilot region in the range 28° < l < 36°. Top: combination of the VLA D configuration and the Effelsberg single-dish images. Bottom: D configuration VLA image of the full continuum of the same longitude range already shown in Medina et al. (2019).
Current usage metrics show cumulative count of Article Views (full-text article views including HTML views, PDF and ePub downloads, according to the available data) and Abstracts Views on Vision4Press platform.
Data correspond to usage on the plateform after 2015. The current usage metrics is available 48-96 hours after online publication and is updated daily on week days.
Initial download of the metrics may take a while.