Fig. 2.
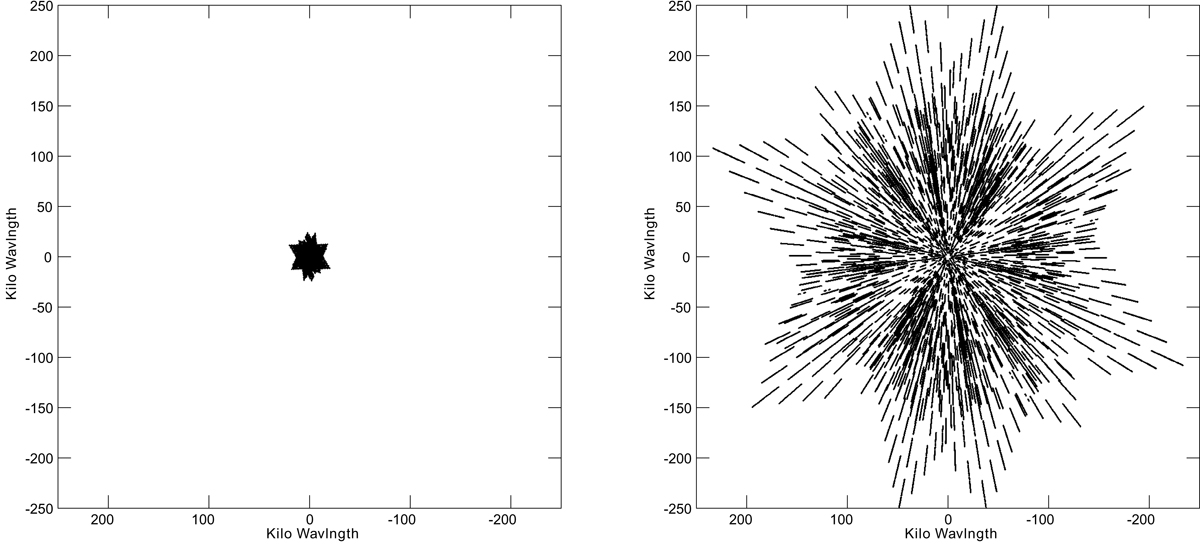
uv-coverage of a single source at high declination from the D configuration (left) and B configuration (right) observations. While both configurations probe very different ranges, there is significant overlap in the center that allows the combination into a single image. Part of this overlap is due to the large bandwidth covered by the observations.
Current usage metrics show cumulative count of Article Views (full-text article views including HTML views, PDF and ePub downloads, according to the available data) and Abstracts Views on Vision4Press platform.
Data correspond to usage on the plateform after 2015. The current usage metrics is available 48-96 hours after online publication and is updated daily on week days.
Initial download of the metrics may take a while.