Fig. 13.
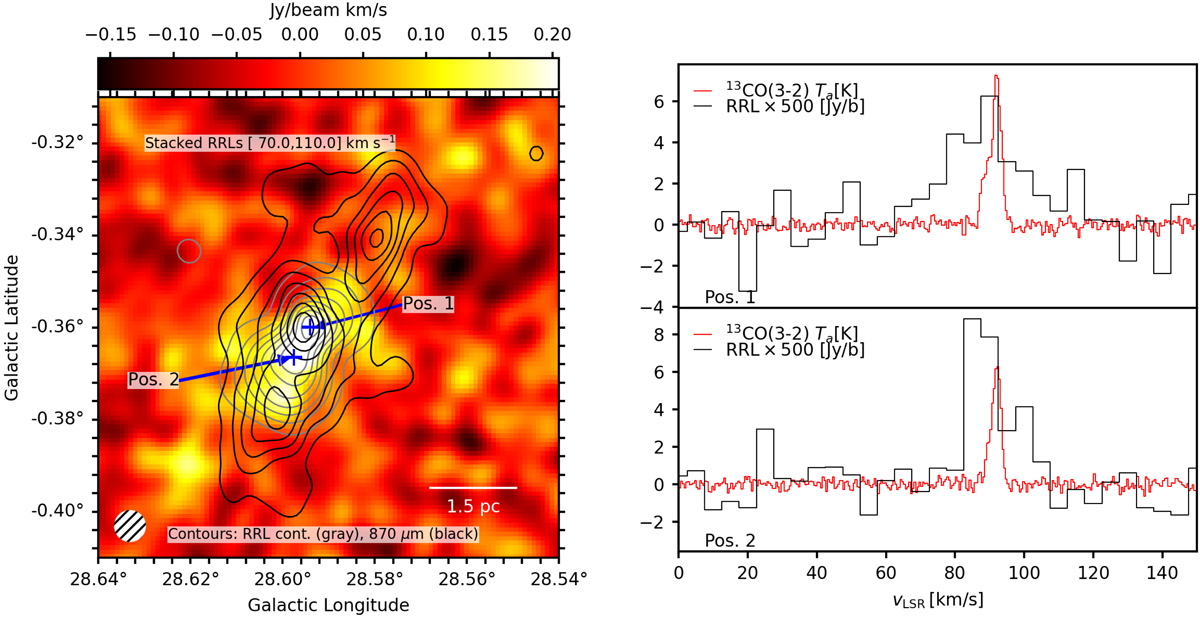
Overview of the RRL emission of the H II region G28.59−0.364. The left panel shows integrated, stacked RRL emission at 25″ resolution. The GLOSTAR broadband 5.8 GHz continuum (gray contours) from −0.005 Jy beam−1 in steps of 0.01 Jy beam−1. ATLASGAL 870 μm emission (Schuller et al. 2009) is shown (black contours) starting from 0.2 Jy beam−1 in steps of 0.2 Jy beam−1. The right panel shows 13CO (3–2) emission (in red) from the CHIMPS survey (Rigby et al. 2016). All data have been smoothed to the angular resolution of the RRL data of 25″. The positions of extracted spectra in the side panels are indicated with blue crosses.
Current usage metrics show cumulative count of Article Views (full-text article views including HTML views, PDF and ePub downloads, according to the available data) and Abstracts Views on Vision4Press platform.
Data correspond to usage on the plateform after 2015. The current usage metrics is available 48-96 hours after online publication and is updated daily on week days.
Initial download of the metrics may take a while.