Open Access
Fig. 12.
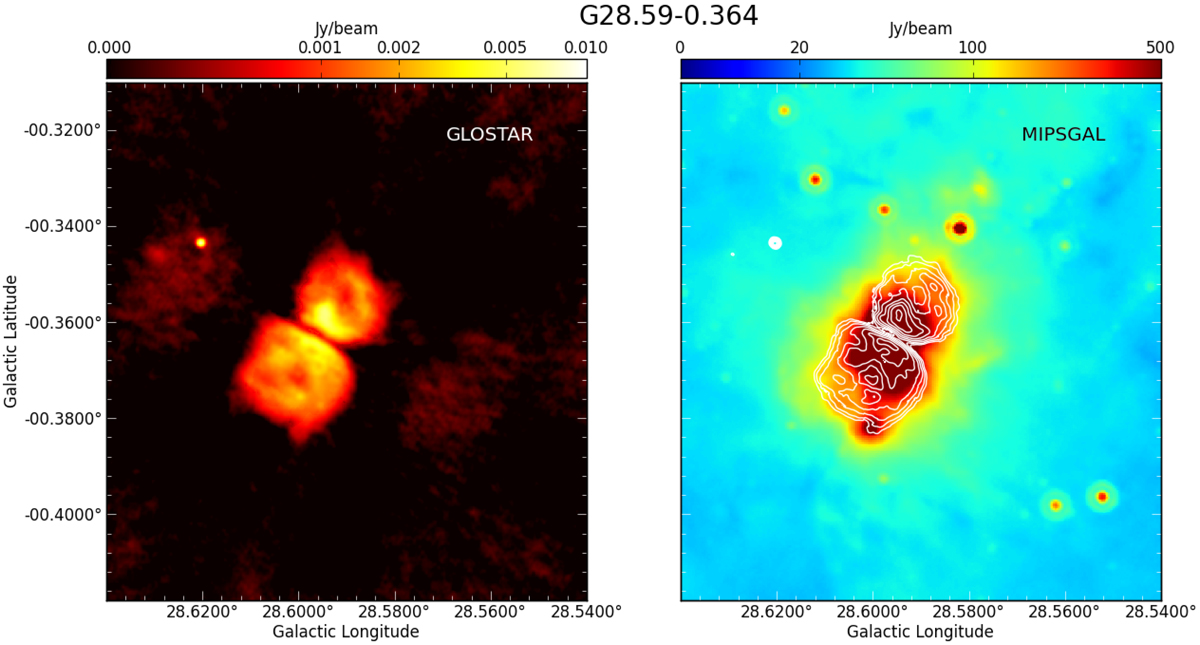
Continuum image of the H II region G28.594−0.359 from the combined VLA D+B-configuration data (left), and an MIPSGAL 24 μm image with the radio contours overlaid (right). The diffuse emission on both sides are most likely weak residual side lobes.
Current usage metrics show cumulative count of Article Views (full-text article views including HTML views, PDF and ePub downloads, according to the available data) and Abstracts Views on Vision4Press platform.
Data correspond to usage on the plateform after 2015. The current usage metrics is available 48-96 hours after online publication and is updated daily on week days.
Initial download of the metrics may take a while.