Fig. 11.
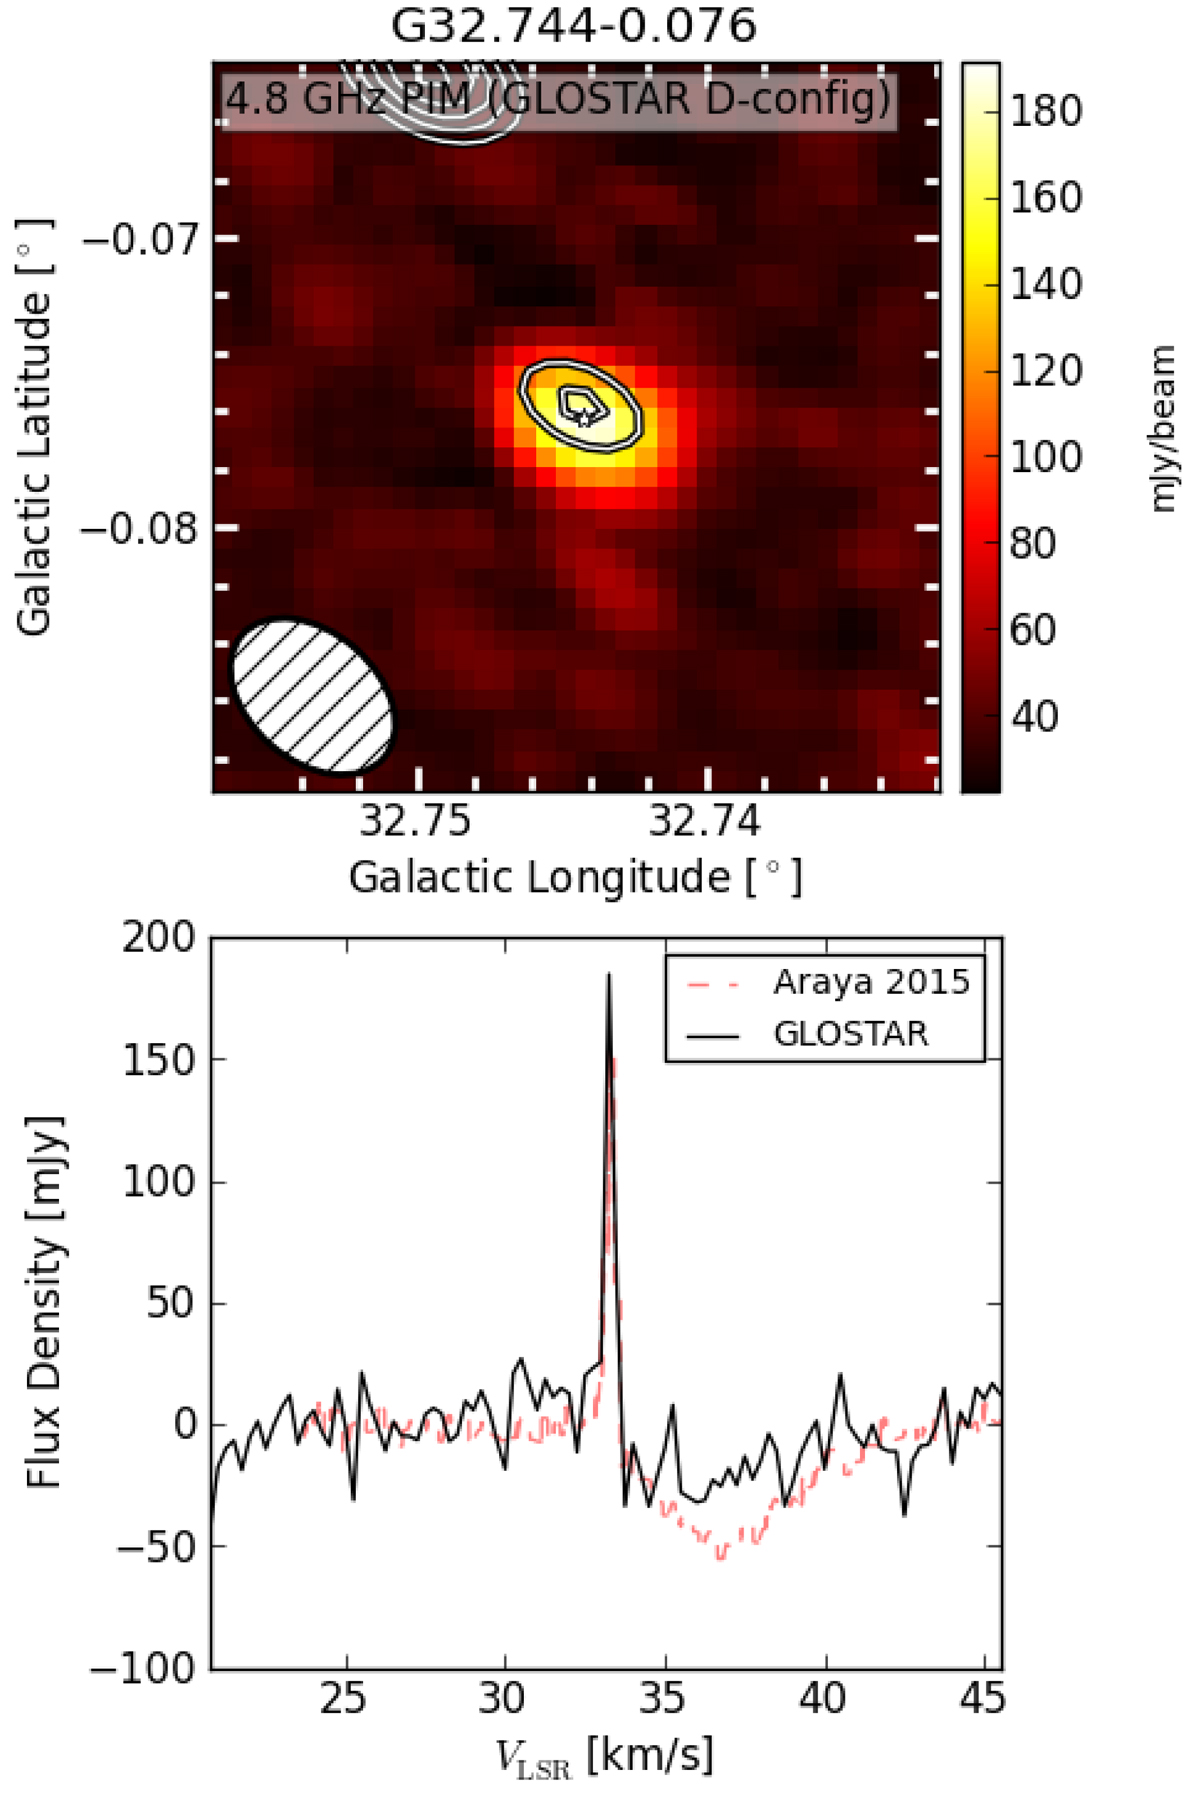
Formaldehyde maser in G32.744−0.076. Top: peak intensity map of known 4.8 GHz formaldehyde maser G32.744−0.076 (Araya et al. 2015) using GLOSTAR VLA D-configuration data and the continuum emission (white contours). Bottom: spectra extracted from GLOSTAR (solid black line) and from the Araya et al. (2015) paper (dashed red line). Despite the lower sensitivity of our data, the faint superimposed absorption feature can be seen.
Current usage metrics show cumulative count of Article Views (full-text article views including HTML views, PDF and ePub downloads, according to the available data) and Abstracts Views on Vision4Press platform.
Data correspond to usage on the plateform after 2015. The current usage metrics is available 48-96 hours after online publication and is updated daily on week days.
Initial download of the metrics may take a while.