| Issue |
A&A
Volume 651, July 2021
|
|
|---|---|---|
| Article Number | A27 | |
| Number of page(s) | 9 | |
| Section | Astrophysical processes | |
| DOI | https://doi.org/10.1051/0004-6361/202039398 | |
| Published online | 06 July 2021 | |
Impact of dust diffusion on the rim shape of protoplanetary disks
Department of Astrophysics, University of Bayreuth, Universitätsstraße 30, Bayreuth, Germany
e-mail: benjamin.schobert@uni-bayreuth.de
Received:
11
September
2020
Accepted:
2
May
2021
Context. Multiple mechanisms are known to give rise to turbulence in protoplanetary disks, which facilitates the accretion onto the central star. Small dust particles that are well coupled to the gas undergo diffusion due to this turbulent motion.
Aims. This paper investigates the influence of turbulence-induced dust diffusion on the equilibrium of protoplanetary disks.
Methods. The model accounts for dust sublimation, radiative transfer with the flux-limited diffusion approximation, and dust diffusion. It predicts the density and temperature profiles as well as the dust-to-gas ratio of the disk.
Results. It is shown that dust diffusion can have a large impact: Assuming the dust survives for 104 s or longer before it can be evaporated, this leads the dust diffusion to widen the inner disk considerably. This effect is generated through a feedback mechanism as the diffusion length is much shorter than the disk width. With increasing dust diffusion, the inclination of the inner rim toward the stellar radiation becomes steeper until it is almost vertical. The temperature range of evaporation and condensation, which is linked to the dust composition, has no influence on this effect.
Conclusions. For realistic parameters, dust diffusion cannot be neglected when determining the equilibrium of the disk. Stronger turbulence inside the disk induces more dust diffusion. Therefore, the dust density grows more gradually over a greater distance and less radiation reaches the disk surface. The new equilibrium shape of the disk is more inclined toward the star. This effect is universal and independent of the specific dust composition.
Key words: protoplanetary disks / radiative transfer / diffusion
© ESO 2021
1. Introduction
Herbig Ae Be stars are intermediate mass stars that are younger than the Sun. They have accretion disks that are believed to be the origin of planets. In recent years the resolution at which protoplanetary disks (PPDs) can be observed has increased, making the inner rim more visible and allowing for constraints on its structure. Lazareff et al. (2017) found the ratio between disk height and radius in the inner disk to be z/R ≈ 0.2, which is larger than predicted by previous theoretical models (Vinković & Jurkić 2007; Mulders & Dominik 2012) by a factor of approximately two. The shape of the inner rim has long been debated because it determines the physical conditions in the dusty planet-forming region.
In an early development, Dullemond et al. (2001) modeled the inner rim as a cylindrical wall that truncates the disk where the evaporation temperature of the dust is reached. Isella & Natta (2005) took into consideration that this evaporation temperature is dependent on the gas density, which leads to a rounded rim. Flock et al. (2016) then incorporated this function for the evaporation temperature into their radiative transfer model, confirming the structure of the rim. An alternative explanation for a rounded rim that does not rely on a density-dependent Tev involves the different speeds of dust settling for two species of dust particles (Tannirkulam et al. 2007).
The transition between no dust and dust at the inner rim can be especially difficult to resolve because of the high temperature gradient and the significant change in opacity. In Flock et al. (2016) the dust-to-gas ratio was chosen such that not too much star light would be absorbed within a single cell in order to ensure a smooth transition. Using the same dust description, Schobert et al. (2019) found model solutions with interesting feedback loops when considering the absorption of star light. That work found temperature deviations that manifested as dust walls traveling through the disk. As fluctuations in the spectral energy distribution (SED) with periods of days to weeks are a common observation in PPDs (Flaherty et al. 2014), exploring these fluctuations could prove to be insightful. This paper continues to investigate the idea that these fluctuations are related to the treatment of dust at its evaporation temperature. In light of the observed feedback, and to describe the transition at the dust boundary more realistically, this work introduces the effect of diffusion into the description of the dust.
A complete description of the inner rim necessarily includes dust diffusion. Gas accretion is commonly believed to be facilitated by turbulence. This turbulence will inevitably induce diffusion in the dust particles as long as they are strongly bound to the gas. This builds upon the notion that for micrometer dust particles the Stokes number is close to one, and therefore the dust diffusion coefficient will be nearly equivalent to the gas diffusion coefficient (Brauer et al. 2008). Since neither dust formation nor destruction are instantaneous processes, dust will be found slightly outside of its equilibrium position in regard to temperature. The timescale on which dust can be formed or destroyed is of order 105 − 107 s (Morfill 1988; Tachibana et al. 2011; Nakamura et al. 2007; Lenzuni et al. 1995). Dust diffusion will therefore take place on that timescale. This addition is also beneficial because it naturally smooths the transition from no dust to dust, which was previously difficult to resolve. Therefore, this paper presents a method of incorporating the diffusive motion of the dust particles into the model from Flock et al. (2016) and Schobert et al. (2019).
A short back-of-the-envelope calculation of the length scale corresponding to dust diffusion, ldiff = 6.5 × 10⁻⁴ AU (for details, see Sect. 4.2), suggests that the length scale is negligible to the overall conformation of the inner rim. However, it will be shown in this paper that the impact of dust diffusion is much larger than can be expected from this estimate.
This paper is structured as follows: Sect. 2 explains the model equations introduced to describe the dust diffusion. In Sect. 3 the numerical implementation and convergence criteria are briefly detailed. Section 4 outlines the results and qualitative changes compared to a model without dust diffusion. Section 5 discusses the results in comparison to an analytical prediction and with respect to the rim shape. The paper concludes in Sect. 6 with a summary of the results.
2. Model equations
The model equations used in this work for radiative transfer and hydrostatic equilibrium follow those proposed in Flock et al. (2016) and Schobert et al. (2019). The exact equations and numerical methods are detailed in Schobert et al. (2019). For brevity, only the changes applied to the model compared to Schobert et al. (2019) are outlined in the following section.
2.1. Dust-to-gas ratio
Dust sublimation is of deciding importance for the configuration of the inner rim and thereby for the evolution of the complete disk. Because the dust shields the area behind it from irradiation and because it is heated by the star and the infrared radiation it itself emits, the dust greatly affects the temperature profile of the disk. The transition distance between vapor and condensed dust is very thin and requires special attention.
In order to resolve this thin layer, the dust sublimation formula from Flock et al. (2016) smooths the transition over a temperature range of 100 K and uses the tangens hyperbolicus as a model function. The formula is
![$$ \begin{aligned} f_{\mathrm{d2g,old} } ={\left\{ \begin{array}{ll} \frac{f_{\Delta \tau }}{2} \left\{ 1- \tanh \left[\left(\frac{T-T_{\mathrm{ev} }}{100\,\mathrm{K}}\right)^3\right] \right\} \cdot \left\{ \frac{1- \tanh (1-\tau _*)}{2} \right\} ,&\mathrm{if}\;T>T_{\mathrm{ev} }\\ \frac{f_0}{2} \left\{ 1- \tanh (20-\tau _*)\right\} + f_{\Delta \tau },&\mathrm{otherwise}, \end{array}\right.} \end{aligned} $$](/articles/aa/full_html/2021/07/aa39398-20/aa39398-20-eq1.gif)
where Tev is the dust evaporation temperature, f0 is the reference dust-to-gas ratio, and fΔτ is the transition dust-to-gas ratio. For the dust evaporation temperature, the fitting model proposed by Isella & Natta (2005),
is used. It describes the dependence of the evaporation temperature on the gas density for silicate grains. The transition dust-to-gas ratio (fΔτ) is defined as
where Δr is the radial size of one grid cell. The transition optical depth of Δτ* = 0.3 was chosen so that the absorption of the radiation at the rim can be resolved (Flock et al. 2016). This numerical remedy ensures that the transition can be described within each chosen radial resolution; however, it is not necessitated by the physics involved. Furthermore, it is useful for numeric stability to impose a minimum value of  . The maximum value of f0 = 10−2 was chosen because it reflects the amount of dust present in the interstellar medium (Li & Draine 2001) and therefore represents the maximum ratio in the PPD.
This method, however, becomes discontinuous if an optically thick area is heated above the evaporation temperature. This was observed in Schobert et al. (2019) in the form of dust waves traveling through the inner hole of the disk. To remove this discontinuity from the description, a new formula for the dust-to-gas ratio is presented in this paper that is simpler and continuous:
![$$ \begin{aligned} f_{\rm d2g,new} = \frac{f_0}{2} \left\{ 1-\tanh \left[\left(\frac{T-T_{\mathrm{ev} }}{\Delta T_{\rm dust}}\right)^3\right] \right\} \left\{ \frac{1-\tanh (1-\tau _*)}{2}\right\} , \end{aligned} $$](/articles/aa/full_html/2021/07/aa39398-20/aa39398-20-eq5.gif)
where fΔτ was replaced by f0. This also means that a separation between temperatures above and below the evaporation temperature is no longer necessary because the second case of Eq. (1) is incorporated into the first. It is also preferable to get the same result (fd2g = f0 for low temperatures and high optical depths) as before with just one equation that is continuous. Additionally, a new variable, ΔTdust, is introduced to describe the size of the temperature range over which the dust-to-gas transition occurs. This parameter is dependent on the composition of the dust; in this paper ΔTdust = 100 K is generally chosen, but different values are investigated. This allows the model to be more general. Section 4.3 details the impact of different temperature ranges on the results.
The use of this new formula in the numerical implementation becomes possible by overcoming a pitfall of the previous model: All of the radiation would be absorbed in a single cell if the dust-to-gas ratio were allowed to rise too rapidly. To ensure a smooth transition, the new model now relies on the effect of dust diffusion instead of a staggered dust-to-gas ratio. How dust diffusion was incorporated into the model is explained in the following section.
2.2. Dust diffusion
To derive a description for dust diffusion, one starts with the continuity equation and inserts the advective and diffusive flux components:
where ρ is the density, D the diffusion coefficient, v the fluid velocity, and R any source or sink terms necessary for dust description. Because of the relative smallness of the diffusion term, one can neglect it at first and solve the equations for the purely advective case. This leads to the hydrostatic solution for the gas density (Flock et al. 2016; Schobert et al. 2019) and to ρdust = fd2gρgas = ρ0 for the dust density as a best approximation considering that R is not fully known. Inserting this lowest-order solution, ρ0, into the first-order terms leads to:
![$$ \begin{aligned}&\left[1-D \tau _{\rm diff} \nabla ^2\right]\rho _{\rm diff} = \rho _0, \end{aligned} $$](/articles/aa/full_html/2021/07/aa39398-20/aa39398-20-eq9.gif)
where ρ0 is the lowest-order solution for the density including only advection and ρdiff is the first-order solution including diffusion. A forward differentiation was used together with a typical time of τdiff to approximate the derivative. Step (7) uses the fact that the gradient length of the mass density is expected to be much smaller than the length scale on which the diffusion coefficient (D) changes. To implement the diffusion, the following two implicit equations are computed via the BiCGStab solver:
![$$ \begin{aligned}&\left[1- D \tau _{\rm diff} \nabla ^2\right]\rho _{\rm gas,diff} = \rho _{\rm gas} \end{aligned} $$](/articles/aa/full_html/2021/07/aa39398-20/aa39398-20-eq10.gif)
![$$ \begin{aligned}&\left[1- D \tau _{\rm diff} \nabla ^2\right]\rho _{\rm dust,diff} = \rho _{\rm dust}. \end{aligned} $$](/articles/aa/full_html/2021/07/aa39398-20/aa39398-20-eq11.gif)
Here, the dust-to-gas ratio is fd2g = ρdust, diff/ρgas, diff, ρdiff is the respective density of dust or gas after one diffusion time step has taken place, τdiff is the typical time it takes for the dust to condensate or evaporate, and D is the diffusion constant of the dust. The idea is that dust particles that are in the process of forming or being destroyed will still be displaced during that time through the intrinsic turbulence or through the gas with which they are very well coupled. One can imagine this as a residual of the dust because its destruction and formation is not instantaneous.
The diffusion constant of the dust is connected to the gas diffusion by the Stokes number, St (Brauer et al. 2008):
Since St < 1 for small particles, both coefficients approximately match each other (Brauer et al. 2008), and thus Ddust = ν = αcsH.
Typical condensation times for τdiff range from 105 to 107 s (Morfill 1988). The formation timescale of chondrules is 105 s (Tachibana et al. 2011). The formation timescales of corundum and hibonite range from 105 to 107 s (Nakamura et al. 2007). Forsterite has been observed to nucleate within 1.4 × 10⁵ s−3.3 × 10⁵ s (Tachibana et al. 2014). Destruction of silicate grains occurs via sublimation and proceeds under quasi-equilibrium conditions (Lenzuni et al. 1995; Duschl et al. 1996). This implies that the evaporation of silicate dust takes an amount of time comparable to that of its formation. It is a useful simplification to assume one diffusion time as the average time of formation since both the exact time the nucleation of dust particles takes and the time their evaporation takes are dependent on the chemistry of the dust composition as well as on the temperature difference between the evaporation temperature and the environment of the particle. In order to still cover a wide range of possible dust compositions, a study on the effect of different formation timescales is performed in Sect. 4.2.
3. Numerical implementation
This section details the numerical implementation of the model described above as well as the convergence criteria. The first step is to determine the density distribution by solving the hydrostatic equilibrium equations for a given temperature profile using the method detailed in Schobert et al. (2019). The second step is to implicitly solve the two coupled equations for the temperature and radiation energy density. This is done using the BiCSTAB solver first presented by Van der Vorst (1992). For preconditioning, the incomplete LU factorization is used. The final steps are calculating the dust-to-gas ratio with Eq. (4) and then executing one diffusive step. The numerical implementation of the dust diffusion is consistent with the calculation of the radiative equilibrium. It is calculated implicitly for gas and dust density using Eqs. (9) and (10), respectively. This is done using both the BiCGStab solver and LU factorization. After these three steps, the process is repeated, starting again with hydrostatic equilibrium and using the newly obtained temperature distribution. The iterations are continued until the convergence criterion is reached.
3.1. Convergence criterion
The convergence criterion used is the same as that in Schobert et al. (2019), where the relative local changes in density and temperature are observed. These normally show an exponential decline in time and converge faster close to the star than farther out because of the dynamical timescale. By the time the outer regions complete several orbits and the disk is vertically isothermal, the inner regions have completed many more orbits and should also be converged. However, some cases were observed where the inner regions showed periodic behavior. This is discussed in detail in Sect. 4.4 and is also consistent with findings from Schobert et al. (2019). In these cases, the disk is considered converged if the outer regions fulfill the convergence criterion and the inner periodic region has completed more than 100 cycles.
3.2. Resolution study
Figure 1 shows the midplane profiles of several key quantities and is zoomed in on the rim transition. The crosses represent grid points at the resolution used in the cases presented in this work. They form continuous, smooth transitions, which are resolved over several grid cells. No jumps or oscillations are visible, and therefore the quantities are well resolved. The critical region in particular, where the optical depth (τ) increases from 0.1 to 10, is resolved over 103 grid points in the midplane. Additionally, to ensure that the numerical resolution is sufficient, a fiducial run at double resolution was performed.
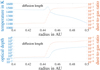 |
Fig. 1. Midplane profiles for temperature, optical depth, and dust-to-gas ratio. The crosses represent grid points, and the lines are to help guide the eye. The small black line labeled “diffusion length” represents one diffusion length, which is smaller than one radial grid cell. |
4. Results
This section presents the findings produced by introducing: (i) the new dust-to-gas ratio, (ii) the influence from both diffusion and the temperature range, and (iii) the effect on the waves that were observed with the previous implementation of the dust-to-gas ratio. The model parameters used are listed in Table 1. These values were chosen because they are typical for Herbig Ae stars (van den Ancker et al. 1998). The surface density was determined using the assumption of a steady state with an accretion rate of Ṁ = 10−8 M⊙ yr−1, except in Sect. 4.4, where the accretion rate is set higher at Ṁ = 10−7 M⊙ yr−1 to show the waves. The lower rate was chosen such that no dust-free hole forms inside the disk, whereas the higher rate includes that feature. In Schobert et al. (2019) it was shown that for accretion rates above Ṁ = 10−8 M⊙ yr−1 the accretion heating can generate a gaseous inner hole in the dust distribution. Waves in the dust density formed inside this cavity; they are examined in Sect. 4.4.
General model setup parameters.
4.1. Differences through the new dust-to-gas ratio
In Fig. 2 the dust densities for the old (Eq. (1)) and new (Eq. (4)) dust-to-gas ratios are compared. The new dust-to-gas ratio formula changes the configuration of the inner region, specifically at the transition between vaporized and condensed dust. As can be seen in Fig. 2, the transition radius lies closer to the star, moving from 0.55 AU to 0.45 AU. Furthermore, the condensed area is wider in the θ-direction at the transition radius and therefore has a steeper angle toward the stellar radiation.
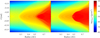 |
Fig. 2. Comparison of old and new dust-to-gas ratio equations. Depicted is the natural logarithm of the dust density for both cases. The simulation on the left uses the old variant (Eq. (1)), whereas the simulation on the right uses the new (Eq. (4)). The y-axis is the polar angle in rad offset by π/2, and the x-axis is the radial distance in AU. |
The regions inward of the transition radius are identical in the two versions; the halo forms in an identical shape and at the same distance from the star. Past 0.8 AU, the models also agree with each other.
At the transition point in the midplane in the right panel of Fig. 2 there is a small line of condensed dust inside the disk. Because the stellar radiation is impinging on the disk that is directly perpendicular to it in the midplane, this point is prone to heat up and condense. In a physical disk with gas turbulence, the dust above and below would be diffused into that line and close this gap. In the following section, this effect is introduced, and even the smallest amount of dust diffusion that we tested effectively mitigates this artifact.
The old dust-to gas ratio kept the amount of dust at the transition artificially small; it used the fΔτ term, such that the absorption of the radiation at the rim could be resolved (Flock et al. 2016). If the amount of dust is artificially diminished, the evaporation front forms farther away from the star. Since fΔτ is a function of the density at each point, the diminishing effect is increased for smaller densities or, equivalently, farther away from the midplane. Removing this artificial factor will therefore move the evaporation closer to the star and, to a greater extent, farther above and below the midplane. These two effects are exactly what we see in Fig. 2. Raising the resolution will increase fΔτ and remedy these effects, beginning in the midplane, as is shown in the appendix of Flock et al. (2016). To completely remedy the effect of fΔτ far above and below the midplane, resolutions that are not obtainable would be necessary. The resolution would need to be increased in both dimensions by at least a factor of 100. Therefore, it is preferable to remove fΔτ from the equation completely. Doing so, however, creates artifacts connected with a poorly resolved radiation absorption, as can be seen in Fig. 2. To remove these artifacts, dust diffusion was introduced as it provides a physically motivated smoothing effect that allows the radiation absorption to be resolved. This was achieved for even for the smallest amount of diffusion tested. Increasing the effect of diffusion to a reasonably motivated amount will change the shape of the rim to an even greater degree, as is discussed in the following section.
4.2. Influence of the diffusion
This section elaborates on the influence of the diffusion. Eight runs with different diffusion times (τdiff) were performed (see Fig. 3). The times were chosen such that they encompass the full possible range of formation times of dust particles as explained in Sect. 2.2. The profiles show where light falling vertically onto the disk reaches an optical depth of unity, which is used as a measure for the height of the disk. The first difference to note is between the two magenta lines, which denote the different ways of calculating the dust-to-gas ratio. With the new formula, Eq. (4) (dashed line), the inner regions of the rim move closer to the star and are more rounded, while the outer regions stay almost unchanged. This is discussed in more detail in Sect. 4.1.
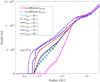 |
Fig. 3. Comparison of eight radial disk height profiles on different diffusion timescales. Depicted is the height vertically above the midplane where the optical depth measured vertically toward the midplane from the box boundary reaches unity. The two magenta lines are cases with no dust diffusion (i.e., τdiff = 0) for the old (solid lines) and new (dashed lines) versions of fd2g as described in Sect. 2.1. The six other cases cover the range of diffusion times from 10 s to 106 s. The small blue bar to the left represents one diffusion length in the vertical direction for τdiff = 105 s. It is significantly smaller than the change in shape of the corresponding blue profile. |
All the profiles with diffusion times given in this section use the new dust-to-gas formula. Comparing the profiles for no diffusion up to a diffusion time τdiff = 103 shows that the change in diffusion time within this range has very little effect on the profile. The starting point in the midplane remains the same; from 0.5 AU to 0.6 AU the profiles deviate slightly from each other, and past that distance they align once again. At first the height slightly decreases with higher diffusion times of up to τdiff = 102, but this trend stops with τdiff = 103, when the height of the disk begins to increase with diffusion time. Overall, the deviances for these four runs are small compared to the ones with higher diffusion times.
Comparing the profiles for diffusion times of τdiff = 103 up to τdiff = 106 shows a stronger influence of diffusion on the profiles. First, the starting point of the profile is closer to the star for higher diffusion times, moving the inner rim inward, and second, the height of the inner regions increases significantly for the closer regions (0.4 AU to 0.5 AU) and moderately for the mid-region (0.5 AU to 0.8 AU). The outer regions again align with one another. This leads to a change in the configuration of the disk. While disks at τdiff = 102 have a narrow rounded-off inner region, disks with diffusion times of τdiff = 104 and higher display an enlarged surface of the inner region with a higher grazing angle. Although a higher grazing angle means a larger area facing the star and therefore more absorption of stellar irradiation, this is mitigated by a more diffused and therefore gradual dust transition, and a new equilibrium is found.
It is interesting to note the discrepancy between the expected diffusion length (ldiff) and the actual scale of the effect. The typical diffusion length is
and can be used to compare the effect of dust diffusion on the rim shape with what could be expected. For the typical values used in this paper – τ = 105 s and Ddust = 1.27 × 10¹¹ m2 s−1, calculated as described in Sect. 2.2 – the diffusion length is ldiff = 1.1 × 10⁸ m = 7.5 × 10⁻⁴ AU. The displacement of the τ = 1 surface as seen in Fig. 3 is an order of magnitude bigger than one diffusion length. This suggests a mechanism that reinforces the effect of diffusion on the rim. The equilibrium disk height with diffusion may potentially be increased further because the radiation from the star is absorbed over a greater distance and more gradually, which allows for a steeper grazing angle in return. The smoother the transition into dust, the steeper the grazing angle can be. This is one explanation for the strong effect of diffusion on the rim shape, which is elaborated on in Sect. 5.2.
4.3. Influence of the temperature range
This section describes the impact of the temperature range ΔTdust over which evaporation occurs. The parameter is introduced in Eq. (4), and its default value is 100 K. Figure 4 shows a comparison between three otherwise identical cases where ΔTdust is 50 K (black line), 100 K (red line), and 200 K (blue line), respectively. The figure shows that the magnitude of the temperature range ΔTdust has little impact on the configuration of the rim. All three cases form a flattened structure with a nearly vertical cusp. However, the range does affect the radius at which the condensation front facing the star forms. In the midplane, the front moves inward, from 0.49 AU in the first case to 0.45 AU and 0.37 AU in the second and third, respectively. If dust can condense at a higher temperature due to the larger range, the optical depth measured radially outward from the star grows faster. This means that the region behind the point, where the first dust particles start to appear (T ≈ Tev − 0.5ΔT), receives less irradiation and the condensation front (T = Tev) moves inward.
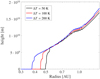 |
Fig. 4. Comparison of three radial disk height profiles for different evaporation temperature ranges. Depicted is the height vertically above the midplane where the optical depth measured vertically toward the midplane from the box boundary reaches unity. The black line is a case with ΔT = 50 K, the red line represents ΔT = 100 K, and the blue ΔT = 200 K. |
Different temperature ranges simulate different dust compositions of the disk. Depending on the size of the grains and their chemical components, they evaporate at different temperatures. Since the configuration of the rim is not greatly affected by the temperature range, the findings of this paper can be applied to a wide variety of disks.
4.4. Waves
In this section a case with an increased accretion rate, Ṁ = 10−7 M⊙ yr−1, is explored. The dust diffusion time (τdiff) is set to 105 s and the temperature range is 100 K.
At these parameters an inner hole forms inside the disk because the heat produced through viscous heating by accretion is sufficiently trapped inside the disk and the midplane heats above the evaporation point, as explained in Schobert et al. (2019). Inside this inner hole, waves in the dust density were traveling through the simulation domain away from the star. However, there are two differences with respect to the case in Schobert et al. (2019). First, the dust walls caused by small temperature deviations that were observed in the previous work are no longer present. This suggests that they were an artifact of the discontinuous dust-to-gas ratio description, as was presumed in that paper. Since the dust-to-gas ratio is less sensitive around the evaporation temperature, a continuous temperature region is present inside the hole with a smooth dust density.
The second difference is that waves in the dust density traverse along the outer perimeter of the disk away from the star. They originate at the closest distance of the disk to the star and then progress away from the star while continuously losing intensity. Eventually they fade into the body of the disk. One such cycle can be seen in Fig. 5. The progression goes from left to right, then from top to bottom, with 3 × 10⁴ s between each panel.
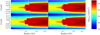 |
Fig. 5. Evolution of one wave cycle. Depicted is the natural logarithm of the dust density at four points in time. The y-axis is the polar angle in rad offset by π/2, and the x-axis is the radial distance in AU. |
The first step is the formation of a new dust front at the transition radius, which is at approximately 0.3 AU for this case. This front then gradually grows bigger and starts to move radially outward. Once the front is big enough, it splits along the midplane and two separate dust density maxima move along the outer edge of the disk. Along the way, they lose intensity and morph into the disk before they reach 0.4 AU. Once the dust front splits, it leaves the front of the disk open for the next dust front to form, and the cycle continues. Fourier analysis of the temperature over time at a fixed position in the midplane shows an average dominant wave frequency at 2.19 × 10⁻⁶ Hz (i.e., a period of 5.3 days). Coincidentally, fluctuations of a similar period have been observed in protostellar disks (Flaherty et al. 2014). For the shown case, the effect of these density fluctuations on synthetic SEDs of the disk was found to be negligible by Dullemond et al. (2012) using RADMC3D, but the intensity of these waves depends on the diffusion time chosen, as well as the surface density of the disk (which is determined here through the accretion rate). These waves are consistently found for every parameter set but are more pronounced for longer diffusion times as well as higher surface densities.
5. Discussion
This section discusses the results in comparison to another theoretical model and quantifies the effects on rim shape and grazing angle. Synthetic images are shown that represent what different levels of diffusion would look like observationally.
5.1. Theoretical comparison
The cylindrical shape of the rim toward the star is reminiscent of a model previously proposed by Dullemond et al. (2001). This section compares that model to the findings of this paper, specifically the rim radius and rim height.
The rim position was determined in Dullemond et al. (2001) as the radius where radiative equilibrium is reached at the evaporation temperature:
where L* is stellar luminosity, Trim the evaporation temperature at the rim, σ the Stefan-Boltzmann constant, and Hrim = χrimhrim the height of the disk at the rim, which is χrim times the pressure scale height at that location. The second factor of this equation takes into account the radiation that is reemitted from the opposing disk area.
To calculate χrim, a vertical Gaussian density profile is assumed, as well as a linear behavior of H(R)/R with a slope of −1/8 (see Appendix A.3 in Dullemond et al. 2001). Here the surface height is defined to be the height to which the optical depth (τ) of the rim on a radially outward directed ray is greater than one:
where erf(x) denotes the error function and Σ is the gas surface density of the disk.
While in Dullemond et al. (2001)Σ is chosen to be constant, this work has a radially dependent surface density. Therefore, Σ(Rrim) needs to be chosen self-consistently to calculate χ, which in turn is needed to iteratively find Rrim with Eq. (13). This yields  and
and  AU. However, since the simulation does not take into account the reemitted radiation at the opposing dust rim, it is advantageous for the comparison to neglect the second factor of Eq. (13), which yields
  and
and  AU. The height ratio χ does not change within two decimals because the change in surface density is small and the radius moves slightly inward, as expected if less radiation falls onto the rim. These last two values (i.e.,
  and
and  AU) are illustrated in Fig. 6 by the solid line.
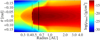 |
Fig. 6. Comparison between analytical prediction and simulation. The dashed line shows Rrim and the disk height calculated from the simulation, and the solid line shows Rrim and the disk height calculated as in Dullemond et al. (2001). Depicted is the natural logarithm of the dust density for the case with ΔT = 100 K. |
For comparison, the same quantities can be calculated from the simulation data, where  is the radius (where the optical depth in the midplane measured from the star reaches one) and
  is found through the height (where the optical depth at the boundary facing away from the star minus the optical depth at the rim radius reaches one). This yields
  and
and  AU and is illustrated in Fig. 6 by the dotted line. The discrepancy in radius can be explained by the difference caused by slowly increasing the dust-to-gas ratio with the radius as in the simulation and switching from no dust being present to the maximum dust-to-gas ratio in the theoretical model. As more stellar radiation is absorbed closer to the star, the equilibrium point moves inward as well. The same effect was observed in Sect. 4.1: When the discontinuity in the dust-to-gas model was removed, the rim radius moved radially inward. The difference in χ is largely due to the change in pressure scale height with radius. As such, it is conducive to also compare the radians covered by the different heights: θsim = 0.29 and θtheo = 0.33. These two values are in reasonably good agreement with each other, as can be seen in Fig. 6. This comparison shows that while an accurate assessment of course demands a numerical simulation, the analytic estimates provide a good approximation.
Another comparison can be drawn to observational data from Lazareff et al. (2017), where the height of the inner rim was estimated by considering the fraction of the stellar luminosity that is reprocessed to near-infrared radiation (NIR). That approach leads to z/R ≈ 0.2, which exceeds the predictions of previous hydrostatic models by a factor of two (Vinković & Jurkić 2007; Mulders & Dominik 2012). However, it only exceeds the height of the inner rim that is discussed in this section: z/R ≈ 0.5 θsim = 0.145 by 38%. This discrepancy can be due in part to the different methods of evaluating the rim height and the specific choice of parameters for the case presented in this section. Nevertheless, incorporating dust diffusion into hydrostatic models is a possible solution to the mismatch of disk heights in previous simulations and the disk heights observed in Lazareff et al. (2017).
5.2. Rim shape
To characterize the rim shape, it is helpful to divide the rim into two sections. The first one extends from R1, the radius where the vertical optical depth in the near infrared becomes nonzero and ends at R2, the radius where the radial optical depth for the star light is one. This region encompasses the very beginning of the disk and is nearly vertical for higher diffusion cases. The angle β1 is calculated from the disk height at R2 and the difference between the two radii (R1 and R2).
The second section lies beyond R2 and extends to R3, the radius where the midplane temperature falls below 1000 K. Corresponding to this section, an angle β2 can be calculated, which is the average disk angle between R2 and R3. The angle βtotal is the average angle of the disk from R1 to R3. The values χ2 and χ3 are the ratios of disk height, calculated with the vertical NIRR optical depth, and the pressure scale height at R2 and R3.
In Table 2 the values for β1 suggest that the diffusion does not significantly influence the angle of the first section, up to a diffusion time of 102 s. For higher diffusion times, the angle rapidly steepens until it is fully vertical for the final value. The inner radius (R1) stays identical within two decimals up to a diffusion time of 105 s, and then it starts to slowly decrease with increasing diffusion time. Similarly, R2 moves inward with higher diffusion times, and the distance between these two radii decreases. The effect of the diffusion time on R3 is small except for the two cases with the largest dust transition ranges, τdiff = 106 s and ΔT = 200 K, where the midplane temperature dropped farther from the star because the heating through irradiation could reach farther inside the disk.
Properties of the different models discussed in this paper.
None of the tested cases displayed a shadow cast on the outer region of the disk. The grazing angle always tends to zero before the disk starts to flare again farther out. The change in stellar flux absorbed per unit distance monotonously decreases with the radius. This is in contrast to the theoretical model from the previous section. Heating by accretion keeps the disk hot enough to not collapse into a shadowed region.
The change in the rim shape due to the diffusion of dust is quite dramatic compared to expectations informed by the diffusion length. As mentioned in Sect. 4.2, the displacement of the transition in the vertical direction is two orders of magnitude larger then predicted. Because the transition between evaporated and condensed dust is such a delicate problem, with repercussions for all areas behind it, even small differences can inform a significant change in the overall configuration. Therefore, dust diffusion plays an important role in the formation of the inner rim.
The introduction of dust diffusion allows dust to exist for a short period of time outside of areas where the previous model (without dust diffusion) had predicted it. This newly displaced dust will have a cooling effect on everything in its shadow. More dust particles can form because of the lower temperature in these areas, enhancing the dust-to-gas ratio and thus shifting the position of the dust-to-gas transition. Dust will be displaced by diffusion once again until equilibrium is reached. The shape of the rim is substantially altered through dust diffusion, although the diffusion length is small compared to this change. However, the diffusion length is not small compared to all important scale lengths. The critical distance over which the dust-to-gas transition occurs is comparable to the diffusion length.
5.3. Synthetic images
To provide a realistic view of the rim, synthetic images were created using the RADMC3D code from Dullemond et al. (2012). Figure 7 shows the intensity at a wavelength of 2 μm for a disk with a diffusion time τdiff = 0 s or diffusion turned off (upper panel) and a disk with τdiff = 105 s representing moderate diffusion (lower panel). The disks are viewed from above at an angle of 60° from face-on orientation, and as such the rim can be seen. The luminosity from the star itself is suppressed and the flux conservation is of second order.
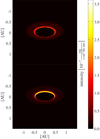 |
Fig. 7. Synthetic images of the disk, viewed 60° from face-on at 2 μm wavelength. The intensity maps correspond to no diffusion (top) and τdiff = 105 s (bottom). |
The case without diffusion shows a thinner and rounder rim compared to the one with diffusion, in agreement with Fig. 3. The peak luminosity is reached at the rim itself in both cases; however, the maximum is 2.1 × 10⁻⁷ erg [s cm2 Hz ster]−1 without diffusion and 3.5 × 10⁻⁷ erg [s cm2 Hz ster]−1 with diffusion. This is a 67% increase in luminosity in the rim region.
The total luminosity is 3.12 × 10⁻⁴ erg [s cm2 Hz ster]−1 without diffusion and 3.31 × 10⁻⁴ erg [s cm2 Hz ster]−1 with diffusion. This is a 6% increase in luminosity in the region of the near-infrared bump.
6. Conclusions
This paper presents a two-dimensional model for PPDs that synchronizes the dust description over all temperature ranges and consistently includes dust diffusion. The model builds upon earlier work (Flock et al. 2016; Schobert et al. 2019), leading to qualitatively new results:
-
Dust diffusion has a far larger impact than a simple estimate of the diffusion length suggests. A feedback effect leads to a more gradual dust transition, which absorbs the stellar radiation along a longer path. This allows for a steeper grazing angle of the inner rim and a wider disk height.
-
Varying the temperature range moves the inner radius, while the general structure of the rim remains unchanged. This means the model is robust for different possible dust compositions.
-
The intensity emitted by the disk at a wavelength of 2 μm is a function of the diffusion time. It increases significantly at the apex of the rim and increases slightly when averaged over the whole disk.
-
No more waves are observed inside the gaseous hole, unlike what was found in Schobert et al. (2019): those waves were an artifact of the discontinuous dust description.
-
Waves in dust density propagate along the outer perimeter of the disk for higher accretion rates and lower dust diffusion times. They display a period of 5.3 days.
The code used to produce these results can be found online1.
References
- Brauer, F., Dullemond, C. P., & Henning, T. 2008, A&A, 480, 859 [NASA ADS] [CrossRef] [EDP Sciences] [Google Scholar]
- Dullemond, C. P., Dominik, C., & Natta, A. 2001, ApJ, 560, 957 [Google Scholar]
- Dullemond, C. P., Juhasz, A., Pohl, A., et al. 2012, Astrophysics Source Code Library [record ascl:1202.015] [Google Scholar]
- Duschl, W. J., Gail, H.-P., & Tscharnuter, W. M. 1996, A&A, 312, 624 [Google Scholar]
- Flaherty, K. M., Muzerolle, J., Wolk, S. J., et al. 2014, ApJ, 793, 2 [NASA ADS] [CrossRef] [Google Scholar]
- Flock, M., Fromang, S., Turner, N. J., & Benisty, M. 2016, ApJ, 827, 144 [NASA ADS] [CrossRef] [Google Scholar]
- Isella, A., & Natta, A. 2005, A&A, 438, 899 [NASA ADS] [CrossRef] [EDP Sciences] [Google Scholar]
- Lazareff, B., Berger, J.-P., Kluska, J., et al. 2017, A&A, 599, A85 [NASA ADS] [CrossRef] [EDP Sciences] [Google Scholar]
- Lenzuni, P., Gail, H.-P., & Henning, T. 1995, ApJ, 447, 848 [NASA ADS] [CrossRef] [Google Scholar]
- Li, A., & Draine, B. T. 2001, ApJ, 554, 778 [Google Scholar]
- Morfill, G. E. 1988, Icarus, 75, 371 [NASA ADS] [CrossRef] [Google Scholar]
- Mulders, G. D., & Dominik, C. 2012, A&A, 539, A9 [NASA ADS] [CrossRef] [EDP Sciences] [Google Scholar]
- Nakamura, T. M., Sugiura, N., Kimura, M., et al. 2007, Meteorit. Planet. Sci., 42, 1249 [CrossRef] [Google Scholar]
- Schobert, B. N., Peeters, A. G., & Rath, F. 2019, ApJ, 881, 56 [CrossRef] [Google Scholar]
- Tachibana, S., Nagahara, H., Ozawa, K., et al. 2011, ApJ, 763, 16 [NASA ADS] [CrossRef] [Google Scholar]
- Tachibana, S., Takigawa, A., Miyake, A., Nagahara, H., & Ozawa, K. 2014, 45th Lunar and Planetary Science Conference, 1226 [Google Scholar]
- Tannirkulam, A., Harries, T. J., & Monnier, J. D. 2007, ApJ, 661, 374 [NASA ADS] [CrossRef] [Google Scholar]
- van den Ancker, M. E., de Winter, D., & Tjin A Djie, H. R. E. 1998, A&A, 330, 145 [Google Scholar]
- Van der Vorst, H. A. 1992, SIAM J. Sci. Stat. Comput., 13, 631 [CrossRef] [MathSciNet] [Google Scholar]
- Vinković, D., & Jurkić, T. 2007, ApJ, 658, 462 [NASA ADS] [CrossRef] [Google Scholar]
All Tables
All Figures
|
Fig. 1. Midplane profiles for temperature, optical depth, and dust-to-gas ratio. The crosses represent grid points, and the lines are to help guide the eye. The small black line labeled “diffusion length” represents one diffusion length, which is smaller than one radial grid cell. |
| In the text | |
|
Fig. 2. Comparison of old and new dust-to-gas ratio equations. Depicted is the natural logarithm of the dust density for both cases. The simulation on the left uses the old variant (Eq. (1)), whereas the simulation on the right uses the new (Eq. (4)). The y-axis is the polar angle in rad offset by π/2, and the x-axis is the radial distance in AU. |
| In the text | |
|
Fig. 3. Comparison of eight radial disk height profiles on different diffusion timescales. Depicted is the height vertically above the midplane where the optical depth measured vertically toward the midplane from the box boundary reaches unity. The two magenta lines are cases with no dust diffusion (i.e., τdiff = 0) for the old (solid lines) and new (dashed lines) versions of fd2g as described in Sect. 2.1. The six other cases cover the range of diffusion times from 10 s to 106 s. The small blue bar to the left represents one diffusion length in the vertical direction for τdiff = 105 s. It is significantly smaller than the change in shape of the corresponding blue profile. |
| In the text | |
|
Fig. 4. Comparison of three radial disk height profiles for different evaporation temperature ranges. Depicted is the height vertically above the midplane where the optical depth measured vertically toward the midplane from the box boundary reaches unity. The black line is a case with ΔT = 50 K, the red line represents ΔT = 100 K, and the blue ΔT = 200 K. |
| In the text | |
|
Fig. 5. Evolution of one wave cycle. Depicted is the natural logarithm of the dust density at four points in time. The y-axis is the polar angle in rad offset by π/2, and the x-axis is the radial distance in AU. |
| In the text | |
|
Fig. 6. Comparison between analytical prediction and simulation. The dashed line shows Rrim and the disk height calculated from the simulation, and the solid line shows Rrim and the disk height calculated as in Dullemond et al. (2001). Depicted is the natural logarithm of the dust density for the case with ΔT = 100 K. |
| In the text | |
|
Fig. 7. Synthetic images of the disk, viewed 60° from face-on at 2 μm wavelength. The intensity maps correspond to no diffusion (top) and τdiff = 105 s (bottom). |
| In the text | |
Current usage metrics show cumulative count of Article Views (full-text article views including HTML views, PDF and ePub downloads, according to the available data) and Abstracts Views on Vision4Press platform.
Data correspond to usage on the plateform after 2015. The current usage metrics is available 48-96 hours after online publication and is updated daily on week days.
Initial download of the metrics may take a while.