| Issue |
A&A
Volume 650, June 2021
|
|
|---|---|---|
| Article Number | A85 | |
| Number of page(s) | 13 | |
| Section | Interstellar and circumstellar matter | |
| DOI | https://doi.org/10.1051/0004-6361/202140780 | |
| Published online | 10 June 2021 | |
Formation of complex organic molecules in molecular clouds: acetaldehyde, vinyl alcohol, ketene, and ethanol via the “energetic” processing of C2H2 ice
1
Laboratory Astrophysics Group of the Max Planck Institute for Astronomy at the Friedrich Schiller University Jena, Institute of Solid State Physics,
Helmholtzweg 3,
07743
Jena,
Germany
e-mail: This email address is being protected from spambots. You need JavaScript enabled to view it.
2
Laboratory for Astrophysics, Leiden Observatory, Leiden University,
PO Box 9513,
2300
RA Leiden,
The Netherlands
3
INAF – Osservatorio Astrofisico di Catania,
via Santa Sofia 78,
95123
Catania,
Italy
4
Research Laboratory for Astrochemistry, Ural Federal University,
Kuibysheva St. 48,
620026
Ekaterinburg,
Russia
5
Max Planck Institute for Astronomy,
Königstuhl 17,
69117
Heidelberg,
Germany
Received:
10
March
2021
Accepted:
1
April
2021
Abstract
Context. The simultaneous detection of organic molecules of the form C2HnO, such as ketene (CH2CO), acetaldehyde (CH3CHO), and ethanol (CH3CH2OH), toward early star-forming regions offers hints of a shared chemical history. Several reaction routes have been proposed and experimentally verified under various interstellar conditions to explain the formation pathways involved. Most noticeably, the non-energetic processing of C2H2 ice with OH-radicals and H-atoms was shown to provide formation routes to ketene, acetaldehyde, ethanol, and vinyl alcohol (CH2CHOH) along the H2O formation sequence on grain surfaces in translucent clouds.
Aims. In this work, the non-energetic formation scheme is extended with laboratory measurements focusing on the energetic counterpart, induced by cosmic rays penetrating the H2O-rich ice mantle. The focus here is on the H+ radiolysis of interstellar C2H2:H2O ice analogs at 17 K.
Methods. Ultra-high vacuum experiments were performed to investigate the 200 keV H+ radiolysis chemistry of predeposited C2H2:H2O ices, both as mixed and layered geometries. Fourier-transform infrared spectroscopy was used to monitor in situ newly formed species as a function of the accumulated energy dose (or H+ fluence). The infrared spectral assignments are further confirmed in isotope labeling experiments using H218O.
Results. The energetic processing of C2H2:H2O ice not only results in the formation of (semi-) saturated hydrocarbons (C2H4 and C2H6) and polyynes as well as cumulenes (C4H2 and C4H4), but it also efficiently forms O-bearing COMs, including vinyl alcohol, ketene, acetaldehyde, and ethanol, for which the reaction cross-section and product composition are derived. A clear composition transition of the product, from H-poor to H-rich species, is observed as a function of the accumulated energy dose. Furthermore, the astronomical relevance of the resulting reaction network is discussed.
Key words: astrochemistry / methods: laboratory: solid state / infrared: ISM / ISM: molecules / molecular processes / cosmic rays
© K.-J. Chuang et al. 2021
 Open Access article, published by EDP Sciences, under the terms of the Creative Commons Attribution License (https://creativecommons.org/licenses/by/4.0), which permits unrestricted use, distribution, and reproduction in any medium, provided the original work is properly cited.
Open Access funding provided by Max Planck Society.
1 Introduction
Interstellar complex organic molecules (COMs), which are referred to as organic compounds consisting of more than six atoms, are present in various star-forming stages, stretching from interstellar clouds to comets in our Solar System (Herbst & van Dishoeck 2009; Biver et al. 2014; Altwegg et al. 2017; Herbst 2017). Aside from a large number of heterogeneous COMs being hosted in massive hot cores and giant molecular clouds, such as Orion KL, Sgr B2N, and TMC-1, over the past decade, several oxygen-bearing COMs have also been unambiguously identified toward low-mass protostars, such as IRAS 16923-2422, NGC1333 IRAS 2A, and NGC1333 IRAS 4A, as well as prestellar sources, such as B1-b, L1689B, and B5 (Bisschop et al. 2008; Öberg et al. 2010; Bacmann et al. 2012; Cernicharo et al. 2012; Coutens et al. 2015; Taquet et al. 2015, 2017; Jørgensen et al. 2016; Rivilla et al. 2017). For example, COMs described by the formula C2 HnO2 (n = 4 and 6), such as glycolaldehyde (HCOCH2OH), methyl formate (HCOOCH3), and ethylene glycol (HOCH2CH2OH), have been observed toward the solar-mass protostar IRAS 16923-2422 (Jørgensen et al. 2012, 2016). The simultaneous detection of these COMs, characterized by their degree of hydrogenation, implies that they are likely to share similar formation mechanisms. Such a chemical link is also found in another group of O-bearing COMs expressed by the formula C2 HnO (n = 2, 4, and 6), namely, ketene (CH2 CO), acetaldehyde (CH3 CHO), and ethanol (CH3 CH2OH). Also these species have been detected toward several protostellar sources, such as NGC 7129 FIRS 2, SVS13-A, IRAS 16923-2422, and the L1157-B1 shock region (Bisschop et al. 2007; Fuente et al. 2014; Lefloch et al. 2017; Bianchi et al. 2018; Jørgensen et al. 2020).
Unlike the case of molecules of the form C2 HnO2, the formation chemistry of species of the form C2 HnO, is still underdebate (Enrique-Romero et al. 2016, 2020). Several solid-state mechanisms, such as radical associations, O-atom additions, and hydroxylation, or gas-phase routes have been pro- posed (Charnley 2004; Balucani et al. 2015; Taquet et al. 2016; Chuang et al. 2020). For example, Bennett et al. (2005a) reported acetaldehyde formation through radical association reactions between CH3 and HCO, which immediately form upon the electron bombardment of a CO:CH4 ice mixture. Furthermore, electron-induced chemistry using isotope-labeled reactants in combination with mass spectrometry confirmed the formation of other derivatives, including ketene and vinyl alcohol (Maity et al. 2014; Abplanalpa et al. 2016). More recently, the reaction of CH3 + HCO was studied theoretically, suggesting that the branching ratios of the final products, that is, CH3 CHO and CO + CH4, are dependent on the initial orientation of the reactants (Lamberts et al. 2019). Another possible solid-state pathway leading to C2 HnO species is through the interactions of hydrocarbons, such as ethylene (C2 H4) and ethane (C2 H6), with suprathermal (“hot”) O-atoms (DeMore 1969). For example, Hawkins & Andrews (1983) reported the formation of three different C2 H4O isomers (i.e., acetaldehyde, vinyl alcohol, and ethylene oxide) and ketene upon photolysis of C2 H4:O3 in an Ar matrix at 15–20 K. Similar products (with exception of ketene) have also been found in electron-induced suprathermal O-atom experiments using a C2 H4:CO2 ice mixture (Bennett et al. 2005b). Recent laboratory research by Bergner et al. (2019) studying the interactions between C2 H4 and excited O-atoms (1D) generated upon UV-photolysis of CO2 only confirmed the formation of acetaldehyde and ethylene oxide, while vinyl alcohol formation was not reported. Their experimental results also showed that the excited O-atoms (1 D) reacting with C2 H2 or C2 H6 results in ketene and in acetaldehyde and ethanol, respectively. These previous studies indicate that the production of particular C2 HnO species formed in suprathermal O-atom induced chemistry is strongly dependent on the type of initial reactants and the excited state of the reacting O-atom. Moreover, H-atom abstraction reactions induced by O-atoms (1 D or 3P) and the recombination of H- and O-atoms originating from energetic dissociation are expected to produce hydroxyl (OH) radicals, which in turn can further react with unsaturated hydrocarbons (e.g., C2 H2 and C2 H4) through relatively low barriers (Miller & Melius 1989; Zellner & Lorenz 1984; Basiuk & Kobayashi 2004; Cleary et al. 2006; McKee et al. 2007). In laboratory studies, Hudson & Moore (1997) reported the C2 H2 hydroxylation resulting in the formation of acetaldehyde and ethanol in H+ radiolysis of a C2 H2:H2O ice mixture at 15 K. Later, other chemically relevant species such as vinyl alcohol and ketene were also identified in similar ice analogs (Hudson et al. 2003; Hudson & Loeffler 2013). Similar organic products have also been observed upon UV-photon irradiation of a C2 H2:H2O ice mixture at 10 K (Wu et al. 2002). These experimental studies underline the important role of vinyl alcohol as a key species in the C2 H2:H2O chemistry linking to the formation of ketene, acetaldehyde, and ethanol on grain surfaces. Energetic processing of C2 H2 has also been proposed to form larger hydrocarbons; proton radiolysis of pure C2 H2 leads to the formation of polyynes (sp-hybridized bond) under astronomically relevant conditions (Compagnini et al. 2009).
In molecular clouds, OH-radicals are expected to be abundantly produced through barrierless atomic reactions such as O + H → OH and O2 + 2H → 2OH on dust grains and considered as indispensable precursor of interstellar H2 O ice (Cuppen & Herbst 2007). Therefore, the direct OH-radical attachment to the available C2 H2 ice offers an alternative reaction route forming COMs without the need for suprathermal O-atoms originating from energetic processing (i.e., dissociation reactions). Very recently, the surface chemistry of C2 H2 with “non-energetic” OH-radicals and H-atoms has been experimentally investigated under translucent cloud conditions (Chuang et al. 2020). Here, the term “non-energetic” refers to “thermalized” species reacting with interstellar ice and has been conventionally used to contrast with energetic chemical triggers, such as photons and fast ions as well as electrons (Watanabe & Kouchi 2008; Linnartz et al. 2015; Arumainayagam et al. 2019). It should be noted that non-energetic reactions indisputably involve energy changes. This study validated the formation of several chemically linked C2 HnO molecules, such as vinyl alcohol, acetaldehyde, ketene, and ethanol, along with the H2 O ice-forming sequence. The continuous impact of energetic particles or cosmic ray-induced UV-photons will also energetically manipulate the surface chemistry of accumulated ice mantles on dust grains. Therefore, the similar interactions between unsaturated hydrocarbons and available H-atoms or OH-radicals released from H2 O dissociation are also expected to occur in ice bulks, where C2 H2 is preserved in H2O-rich ice, or these interactions take place at the interface region between hydrogenated amorphous carbon (HAC) dust and the H2 O ice layer.
In parallel with non-energetic processing in molecular clouds, this work is aimed at investigating the role of energetic processing of unsaturated hydrocarbons, which are deeply buried in or beneath H2 O ice, through impacting cosmic rays before the ice thermally desorbs due to protostar heating. The experimental study presented here is motivated by the abundant detection of C2 H2 with its fragments C2H and simultaneous detection of chemically linked C2 HnO species across various stages of star formation showing distinct COMs composition. More specifically, we investigated the proton (H+) induced chemistry for C2 H2:H2O mixed and layered ice analogs in order to mimic the two scenarios: C2 H2 preserved in and capped by H2O ice. The evolution of newly formed COMs, is derived as a function of the accumulated energy dose. The experimental details are described in the next section. The results are presented in Sect. 3 and discussed in Sect. 4. Section 5 focuses on the astronomical relevance of the new data presented here and gives our conclusions.
2 Experimental details
All experiments were performed using the ultra-high vacuum (UHV) apparatus located at the Laboratory for Experimental Astrophysics in Catania. The details of the experimental setup and the latest modifications with the updated calibrations have been described in Strazzulla et al. (2001) and Baratta et al. (2015). Here, only the relevant information of this laboratory work is presented. A sample holder using a KBr window as substrate is mounted on the tip of a closed-cycle helium cryostat and positioned at the center of the UHV chamber. The substrate temperaturemonitored by a silicon diode with <1 K relative accuracy can be regulated between 17 and 300 K by an Oxford temperature controller equipped with a resistive heater. The base pressure in the main chamber is ~ 2 × 10⁻⁹ mbar at room temperature. The KBr substrate is fixed at an angle of 45° for both the infrared (IR) beam and the ion beam path. The proton (200 keV H+) source used for the energetic processing of the C2 H2 ice is comprised of a Danfysik 1080-200 ion implanter installed in a separate vacuum line (with a base pressure of ~ 1 × 10⁻⁷ mbar), which is connected to the UHV chamber by a UHV gate valve. The ion beam is guided to the main chamber through ion optics, and its spot is electrostatically swept to provide a uniform bombardment cross-section with an area of 1 cm2 covering theentire diagnostic sampling region of the IR beam. The ion fluence is recorded in situ by a current integrator and further converted to an energy dose using the stopping power estimated by the SRIM simulation for each experiment (Ziegler et al. 2011)via the equation:
 (1)
(1)
where S(200 keV) is the stopping power for 200 keV H+ in units of eV cm2 per 16u-molecule, and F(200 keV) is the total number of impinging 200 keV H+ per area in units of protons cm−2.
Gaseous C2 H2 (Air Liquide; ≥99.6%) and H2O (Sigma-Aldrich Chromasolv Plus) or H218O vapor (Sigma-Aldrich; ≥97%), purified through multiple freeze-pump–thaw cycles, are introduced into the main chamber through an all-metal needle valve. Ice samples are deposited by applying “background deposition,” ensuring a rather uniform structure. Two types of ice samples are prepared: “mixed” and “layered” samples. For the deposition of the mixed ice sample, gases of C2 H2 and H2O are pre-mixed in a gas-mixing chamber and then condensed on the pre-cooled KBr substrate at 17 K. For the layered ice sample, a sequential deposition of C2 H2 gas and H2O vapor is applied and repeated multiple times to reach the same H2O ice thickness as that of the mixed samples. The applied geometry of layered ice, consisting of depositing C2 H2 first and followed by H2O, is not only intended to mimic the interstellar ice mantle, where H2 O ice is accumulated on top of HAC dust, but also to amplify the signal of ongoing interface reactions. The growth of the ice sample is strictly limited to the front side, which is realized by a special design of the sample holder (see Sicilia et al. 2012 for details). The ice thicknesses are monitored in situ by He-Ne laser interference measurements following the procedure described in Baratta & Palumbo (1998) and Urso et al. (2016) and in the range of 0.54–0.71 μm, which is below the penetration depth of the impacting 200 keV H+.
The ice sample is monitored using Fourier transform infrared spectroscopy (FTIR) in a range from 400 to 7500 cm−1 with 1 cm−1 resolution. The IR absorption area is obtained by Gaussian fitting with one standard deviation used as an error bar. This estimation does not account for uncertainties originating from the baseline subtraction procedure. The column density of parent and productspecies are further derived by the modified Beer-Lambert law converting IR absorbance area (i.e., optical depth area multiplied by the converting factor of ln 10) to absolute abundance. The applied absorption band strength value of C2 H2 has been directly measured on the same experimental setup, while other species’ values are taken from the literature (see Table 1). The ratio of the predeposited C2 H2:H2O (C2 H2:H218O) ice mixture is 0.4:1 (0.2:1), where H2O concentration is always overabundant compared to C2 H2. The product’s abundance ratio of CH2C18O over C18O as a function of H+ fluence is assumed to be similar to the abundance ratio of CH2CO over CO in a regular H+ radiolysis experiment, where ketene and carbon monoxide cannot be deconvoluted. We note that a recently published absorption band strength for acetaldehyde (see Hudson & Ferrante 2020) shows a non-negligible inconsistency for the CH3 deformation mode (ν7; ~ 1350 cm−1) of acetaldehyde among the available literature values. However, the newly reported band strength, namely 5.3 × 10⁻¹⁸ cm molecule−1 for the CH wagging mode (ν8; ~ 1135 cm−1) of acetaldehyde is close to the value of 4.3 × 10⁻¹⁸ cm molecule−1 that is used in this work. The latter value is taken from Bennett et al. (2005b). In order to minimize the relative uncertainty in the absolute abundances, the band strengths of acetaldehyde and vinyl alcohol are both taken from the theoretical value reported in that work. The utilized absorption peaks of species studied in this work and their corresponding absorption band strength are summarized in Table 1. The obtained column density can easily be recalibrated as soon as more precise values become available.
Summary of IR band strength values used for the species analyzed in this work.
3 Results
3.1 Product formation of 200 keV H+ radiolysis of C2 H2:H2O mixed and layered ices
Figure 1 presents the IR absorption spectra obtained after (a) deposition of C2 H2:H2O mixed ice in a ratio of 0.4:1 and (b) 200 keV H+ radiolysis (i.e., C2 H2:H2O + H+) with an H+ fluence of 6.0 × 10¹⁴ protons cm−2 (i.e., ~16.4 eV 16u-molecule−1) at 17 K. In the IR spectrum (a) of Fig. 1, the initial C2 H2 ice is visible at 758 cm−1 (ν5; CH bending), 1374–1422 cm−1 (ν4 +ν5; combination), and 3239 cm−1 (ν3; CH stretching) (Knez et al. 2012; Hudson et al. 2014). The water ice shows up through four broad features at ~742 cm−1 (libration), ~1646 cm−1 (ν2; OH bending), ~3329 cm−1 (ν1, ν3; OH stretching), and ~3600 cm−1 (νR; OH dangling) (Gerakines et al. 1995). The presence of the H2O dangling band implies a relatively high porosity of the deposited ice mixture. The relatively weak signals at 1955 and ~1230 cm−1 originate most likely from low concentration impurities (e.g., Cn Hm) in the acetylene precursor gas that was used. The acetone contamination, which is commonly seen in the acetylene gas bottle, is negligible; the ratio of N(CH3COCH3) over deposited N(C2H2) is below 0.8%. In spectrum (b) of Fig. 1, the peak intensity of signals due to C2 H2 and H2O significantly decrease after H+ radiolysis. Moreover, the depletion of OH-dangling band is clearly observed suggesting the collapse of the porous structure of the ice bulk upon protons impact (Palumbo 2006). Several new IR features show up; C2 H4 can be identified by its vibrational bands at 1437 cm−1 (ν12; CH2 scissoring) and 956 cm−1 (ν7; CH2 wagging), and C2 H6 exhibits its characteristic features at 2975 cm−1 (ν7; CH asym. stretching), 2939 cm−1 (ν5; CH sym. stretching), 2879 cm−1 (ν8 +ν11; CH3 asym. deformation), 1457 cm−1 (ν11; CH3 asym. deformation), and 1420 cm−1 (ν6; CH3 sym. deformation) (Shimanouchi 1972; Bennett et al. 2006; Kaiser et al. 2014). This finding is fully in line with the solid-state hydrogenation scheme of C2 H2 → C2H4 → C2H6, proposed in the literature (Tielens 1992; Hiraoka et al. 1999, 2000; Kobayashi et al. 2017; Abplanalp & Kaiser 2020; Chuang et al. 2020). The absence of C2 H3 and C2 H5 implies a low concentration of intermediate radicals, which have been suggested to associate with H-atoms following H2 O dissociation. Radiolysis products with a single C-atom are also found in the IR spectrum (b). This is consistent with the previous radiolysis studies by energetic particles, showing efficient and complete dissociation reactions of initial hydrocarbon species (Kaiser 2002). The IR feature at 1305 cm−1 originates from the CH bending mode (ν4) of CH4. The methane C-H stretching mode at 3010 cm−1 (ν3) is blended by the broad H2 O band centered at 3329 cm−1 (Mulas et al. 1998). CO, CO2, and probably HOCO also shows up through bands at 2135 cm−1 (CO stretching), 2341 cm−1 (ν3; O=C=O stretching), and 1845 cm−1 (ν2; C=O stretching), respectively (Milligan & Jacox 1971; Ryazantsev et al. 2017).
Aside from the above assignments of simple hydrocarbons and carbon-bearing molecules, the IR spectrum (b) of Fig. 1 also shows the formation of oxygen-bearing COMs in the C2 H2:H2O + H+ experiment. For example, vinyl alcohol is identified through its CO stretching (ν9), C=C stretching (ν5), and Fermi resonance with the CH2 wagging overtone (2ν13) at 1147, 1640, and 1665 cm−1, respectively (Hawkins & Andrews 1983; Rodler et al. 1984; Koga et al. 1991). The latter two peaks severely overlap with the initial broad H2 O-dominant feature at ~ 1646 cm−1 and the newly formed peak at 1710 cm−1 that is assigned to the C=O stretching mode (ν4) of acetaldehyde. The full identification of acetaldehyde is supported by the simultaneous detection of the CH3 deformation mode (ν7) and C–C stretching mode (ν8) at 1350 and 1135 cm−1, respectively (Hollenstein & Günthard 1971; Hawkins & Andrews 1983; Bennett et al. 2005b; Terwischa van Scheltinga et al. 2018; Hudson & Ferrante 2020). The IR features around 1140 cm−1 correspond to the CO stretching mode of vinyl alcohol and CC stretching mode of acetaldehyde as has been confirmed in a previous isotope-labeled study using C2 H2 + (18)OH + H (see Fig. 2 in Chuang et al. 2020). In the present work, therefore, a spectral deconvolution is applied using Gaussian fitting. As reported in Chuang et al. (2020), ethylene oxide, with the highest internal energy among the three C2 H4O isomers, is absent in the present work. This result also confirms the proposed formation channel of ethylene oxide, which can be only produced in C2 H4 containing ice reacting with O-atoms under ISM-like conditions (Bennett et al. 2005b; Ward & Price 2011; Bergner et al. 2019). The hydrogen saturated product ethanol is identified by its non-overlapped IR peaks at 1046 and 1088 cm−1 that correspond to the CO stretching modes (ν11) and CH3 rocking mode (ν10), respectively (Barnes & Hallam 1970; Mikawa et al. 1971; Boudin et al. 1998). The IR feature of ketene shown at 2135 cm−1 overlaps with the absorption peak of CO (Hudson & Loeffler 2013). The above identifications of O-bearing COMs are fully consistent with the assignment in the previous non-energetic study of OH-radical and H-atom addition reactions to C2 H2 at 10 K (Chuang et al. 2020).
The identifications of these COMs are further secured by utilizing isotope-labeled water ice (i.e., H218O). The comparison between the IR spectra obtained after 200 keV radiolysis of (a) C2 H2:H2O and (b) C2 H2:H218O ice mixtures under very similar experimental conditions at 17 K is shown in Fig. 2. In addition to simple products, such as C18 O2 (CO18O), C18 O, H18 OC18O, and possibly H2 C18O, there are also newly formed oxygen-bearing COMs exhibiting redshifted vibrational modes involving 18O-atoms. For example, the absorption features of CH2C18O and C18O are located at 2108 and 2085 cm−1, respectively (Hudson & Loeffler 2013; Maity et al. 2014; Bergner et al. 2019). The C=18O stretching mode of acetaldehyde shifts from 1710 to 1678 cm−1, while its other vibrational transitions (not involving 18O-atoms), such as the CH3 deformation mode (ν7) and C–C stretching mode (ν8), stay fixed at 1352 and 1135 cm−1 (Hawkins & Andrews 1983; Rodler et al. 1984). Vinyl alcohol is also confirmed by detecting its non-shifted vibrational modes, such as CC stretching (ν5) and Fermi resonance with the CH2 wagging overtone (2ν13) at 1678 and 1640 cm−1, while the C18O stretching mode (ν9) shifts from 1147 to 1131 cm−1 (Hawkins & Andrews 1983; Rodler et al. 1984). The identification of ethanol is supported by detecting the CH3 rocking mode (ν10) at 1088 cm−1 and C18 O stretching modes (ν11), which redshift from 1046 to 1035 cm−1 (Bergner et al. 2019). These IR spectral (non-)shifts strongly support the previous assignments of complex molecules, detected in the 200 keV H+ radiolysis of C2 H2:H2O mixed ice at 17 K.
In order to directly compare the radiolysis products of two sample geometries (i.e., mixed and layered ices), IR difference spectra are utilized to highlight the newly formed absorption features obtained after proton impact by subtracting parent molecular IR peaks. Figure 3 presents the difference spectra for (a) C2 H2:H2O mixed ice, (b) C2 H2:H2O layered ice,and (c) C2 H2:H218O layered ice, obtained at 17 K before and after 200 keV H+ radiolysis for a fluence of 6.0 × 10¹⁴ protons cm−2 (i.e., ~16.4 eV 16u-molecule−1). As mentioned previously, the studied hydrocarbon chemistry with H-atoms or OH-radicals is expected to take place in two relevant interstellar ice mantle regions; one is in the ice bulks where C2 H2 is fully mixed with H2O-rich ice, and another is at the contact surface between H2O ice and HAC. In Fig. 3, depleted peaks of C2 H2 and H2O are intentionally omitted (except for the one at ~ 1400 cm−1) for clarity. In spectrum (a), the newly formed hydrocarbons (e.g., C2 H4 and C2 H6) and COMs (i.e., ketene, vinyl alcohol, acetaldehyde, and ethanol) are seen as positive peaks. Besides the R–(C ≡C)–R peak at 2117 cm−1, a broad feature at ~ 656 cm−1 is tentatively revealed after subtracting the libration peak of H2 O, hinting at the formation of the simplest cumulene (C4 H4) and polyyne (C4 H2). These two products have been reported in the literature investigating energetic processing of pure C2 H2 ice (Compagnini et al. 2009; Abplanalp & Kaiser 2020; Lo et al. 2020; Pereira et al. 2020). In spectrum (b), the absorption peak at 656 cm−1 is significantly enhanced compared to spectrum (a). Moreover, several peaks originating from C4 H4 are observed at 941 cm−1 (ν15), 975 cm−1 (ν14), 1223/1248/1276 cm−1 (2ν17/ν11+ν17/2ν11), ~ 1943 cm−1 (2ν15/2ν14), and broad 3282 cm−1 (ν1; not shown in Fig. 3) (Tørneng et al. 1980; Kim & Kaiser 2009). C4 H2 can also be identified by its ν5 vibration at 2010 cm−1, while its two strong absorption peaks located at ~ 652 cm−1 (ν8 /ν6) and ~ 3277 cm−1 (ν4) cannot be discriminated from eventual C4 H4 bands (Khanna et al. 1988; Zhou et al. 2009). Additionally, the spectral assignments of C4 H4 and C4 H2 are secured by observing the non-shifted peaks in the 200 keV H+ radiolysis of C2 H2:H218O layered ice experiment in the spectrum (c) of Fig. 3. The enhancement of C4 H2 and C4 H4, which is observed in spectra (b) and (c) representing the pure C2 H2 solid-state reactions in layered experiments, implies direct interactions between neighboring C2 H2 molecules and is consistent with the non-detection of C4 Hn (n = 2 and 4) reported in the experiments with mixed C2 H2:H2O ice (Moore & Hudson 1998). This bottom-up chemistry from the simplest alkyne has been proposed as a solid-state pathway enriching longer (hydro-)carbon chains and even (poly-)aromatic hydrocarbons in the ISM (Necula & Scott 2000; Tielens 2013).
In addition to the formation of C2 H2 derivatives, such as polymers, cumulenes, and polyynes, spectrum (b) in Fig. 3 shows other products as visible from spectrum (a), which only can be explained through interface reactions between the C2 H2 and H2O icy layers. The tentative identification of the IR characteristic features of O-bearing COMs is guided by the mixed ice experiments (i.e., spectrum (a) of Fig. 3). In spectrum (b), the IR absorption features of acetaldehyde, vinyl alcohol, and ketene are found at 1352 as well as 1134, 1149, and 2135 cm−1, respectively. Other characteristic IR peaks of these COMs are overlapped with the severely depleted features of C2 H2 and H2O in the omitted regions. The isotope-labeled COMs (e.g., CH2C18O, CH2CH18OH) in spectrum (c) provide extra evidence for the correct assignments through the involved red-shifted peaks upon processing of the C2 H2:H218O layered ice. In general, the intensity of the observed COM peaks in the spectra (b) and (c) is smaller than that shown in the spectrum (a) as would intuitively be expected as well. The difference in product yield is due to the limited availability of C2 H2 for possible interactions with H2O dissociated fragments; both reactants can only meet at the interface of the layered ice.
The present experimental results confirm that in the solid state, the simplest alkyne (i.e., C2 H2) reacts with adjacent C2 H2 fragments (e.g., C2H, CH, and C2) and H-atoms, forming larger hydrocarbons and actively participates in the formation of O-bearing COMs through interactions with H2 O radiolysis products, such as OH-radials and H-atoms. The quantitative analysis of the newly formed COMs and the possible reaction network are discussed in the next sections.
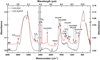 |
Fig. 1 IR spectra obtained after (a, black) deposition of C2H2:H2O mixed ice and (b, red) following ion radiolysis by 200 keV H+ at 17 K. The initial deposition ratio of C2H2:H2O mixed ice was 0.4:1, and the applied H+ fluence was 6.0 × 10¹⁴ protons cm−2. IR spectra are offset for clarity. |
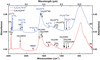 |
Fig. 2 IR spectra obtained after ion bombardment of (a) C2H2:H2O and (b) C2H2:H218O mixed ices by 200 keV H+ at 17 K. The applied deposition ratios were 0.4:1 and 0.2:1 for C2H2:H2O and C2 H2:H218O mixed ices, respectively. The applied H+ fluence for each experiment is 6.0 × 10¹⁴ protons cm−2 (~ 16.4 eV 16u-molecule−1). The blue arrows indicate features that are shifted because of 18O and the dashed lines reflect the absorption features of COMs with 16O. IR spectra are offset for clarity. |
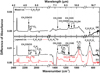 |
Fig. 3 IR difference spectra obtained before and after 200 keV H+ radiolysis of (a) C2H2:H2O mixed ice along with (b) C2H2:H2O and (c) C2H2:H218O layered ices for the same H+ fluence of 6.0 × 10¹⁴ protons cm−2 (i.e., ~ 16.4 eV 16u-molecule−1) at 17 K. The black arrows followed by dashed lines indicate the absorption peaks of regular COMs with 16O-atoms, and red arrows indicate the absorption peaks of COMs with 18O-atoms. IR spectra are offset for clarity. |
3.2 Kinetics of H+ radiolysis of C2 H2:H2O mixed ice
The assigned IR features have been recorded as a function of H+ fluence. As mentioned in Sect. 2, the integrated IR band intensities can be converted to column densities for known absorption band strengths. The resulting abundance evolution both of the parent species and the newly formed COMs is then sufficient to reveal the reaction kinetics induced by the H+ radiolysis.
In Fig. 4, the abundance evolution is shown for the parent C2 H2 (i.e., N(C2H2)) in the left panel and for the newly formed vinyl alcohol, acetaldehyde, ketene, and ethanol in the right panel upon H+ radiolysis of the C2 H2:H2O mixed ice for a H+ fluence up to 6.0 × 10¹⁴ protons cm−2 (i.e., ~16.4 eV 16u-molecule−1). The resulting abundances are normalized to the initial C2 H2 amount, namely N0 (C2H2). The value of N(C2H2)/N0(C2H2) is rapidly decreasing at the beginning of the H+ radiolysis experiment, and the depletion behavior starts slowing down at a H+ fluence of ~ 1.5 × 10¹⁴ protons cm−2 (i.e., ~4.1 eV 16u-molecule−1). At the end of the H+ radiolysis experiment, about 66% of the initial C2 H2 is consumed. A very similar C2 H2 depleting ratio (i.e., ~65%) is observed in the isotope-labeled experiment C2 H2:H218O + H+. The time-resolved evolution of the C2 H2 abundance is further fitted by a single exponential equation (see Eq. (3) in Garozzo et al. 2011):
 (2)
(2)
where α is the saturation value (unitless), F is the H+ fluence in protons cm−2, and σ is the effective reaction cross-section in cm2 proton−1. The derived destruction cross-section is ~ (1.9 ± 0.5) × 10−15 cm2 per H+ (200 keV), which is equal to ~ 0.07 ± 0.02 16u-molecules eV−1.
In the right panel of Fig. 4, the abundance evolution of newly formed products as a function of H+ fluence is shown, illustrating that different species follow different evolutionary tracks. For example, vinyl alcohol is immediately and abundantly formed upon H+ radiolysis, implying that vinyl alcohol is a first-generation product. Later, the increasing N(CH2CHOH)/N0(C2H2) value noticeably slows down around a fluence of ~ 1.5 × 10¹⁴ protons cm−2, which coincides with C2 H2 depletion behavior, and reaches its maximum intensity of ~ 0.037 at a fluence of ~ 3.0 × 10¹⁴ protons cm−2. Such a fast-increasing curve that is followed by rapid depletion has also been observed in previous ion-radiolysis studies of C2 H2:H2O mixed ice (Hudson et al. 2003; Zasimov et al. 2020). A similar kinetic behavior is found in the ketene formation curve, implying a shared chemical history; vinyl alcohol is a precursor of ketene as suggested by Hudson & Loeffler (2013). This chemical link is additionally supported by observing a constant ratio between ketene and vinyl alcohol (i.e., ~ 0.25 ± 0.03) over the entire H+ radiolysis experiment.
Acetaldehyde shows a similarly fast-increasing trend as vinyl alcohol upon start of the H+ radiolysis, representative for a fast enol-keto conversion as observed in previous studies (Abplanalpa et al. 2016; Chuang et al. 2020). This will be further discussed in Sect. 4. However, the acetaldehyde formation curve does not follow vinyl alcohol (or ketene), which starts depleting at a fluence of ~ 3.0 × 10¹⁴ protons cm−2. In contrast, the abundance of acetaldehyde (and also of ethanol) increases continuously with applied H+ fluence. Consequently, the accumulated column density of acetaldehyde at the end of the H+ radiolysis even surpasses the amount of vinyl alcohol. The final column densities of complex products with respect to the initial C2 H2 abundance (i.e., N(products)/N0(C2H2)) are obtained with values of ~0.044, 0.025, 0.020, and 0.006 for acetaldehyde, vinyl alcohol, ethanol, and ketene, respectively. The composition ratios for the reaction products are summarized in Table 2.
The cumulative abundance of all COMs is shown as a black curve in the right panel of Fig. 4 and can be fitted by a single exponential equation:
 (3)
(3)
where α is the saturation value (unitless), F is the H+ fluence in protons cm−2, and σ is the effective reaction cross-section in cm2 proton−1. This results in an effective formation cross-section of ~ (7.2 ± 0.1) × 10−15 cm2 per H+ (i.e., 0.26 ± 0.01 16u-molecule eV−1) for the overall complex products. The pseudo first-order fitting suggests that these products have a common precursor, which acts as a limited reactant in bimolecular reactions. Although the total product abundance nearly reaches a steady-state, the destruction of C2 H2 is still going on (i.e., lower reaction cross-section derived) and resulting in smaller species, such as CH4 and CO (Hudson & Loeffler 2013; Zasimov et al. 2020). Therefore, the obtained conversion ratio of the overall complex products to depleted C2 H2 (i.e., N(products)/ΔN(C2H2)) is a rather dynamic value depending on the applied H+ fluence (or energy dose) (see Table 2).
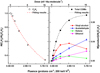 |
Fig. 4 Abundance evolution of the parent C2H2 species (left panel) and the newly formed reaction products (right panel) in the 200 keV H+ radiolysis of C2H2:H2O mixed ice over H+ fluence of 6.0 × 10¹⁴ protons cm−2 (i.e., ~ 16.4 eV 16u-molecule−1). The derived absolute abundances are normalized to the initial C2H2 abundance. The dashed lines present the fitting results, and the solid lines connecting data are only for clarity. |
4 Discussion
The H+ radiolysis ofice mixtures on grain surfaces primarily causes species to dissociate and ionize, generating a cascade of (high- and low-energy) electrons. These reactions efficiently take place along the H+ penetrating path until high energy particles (e.g., protons or electrons) run out of their kinetic energy. The ion radiolysis of H2 O ice has been intensively studied in the literature (Moore & Hudson 2000; Gomis et al. 2004; Loeffler et al. 2006; Buxton 2008; Arumainayagam et al. 2019, and references therein). It has been concluded that the ion-induced excitation of H2 O ice (i.e., H2 O*) is most likely to fragment into OH-radicals and H-atoms and the ionization of H2 O mainly leads to the generation of H2 O+ and e−. These ions and electrons can further reactwith surrounding H2O ice, ultimately enriching the effective abundance of OH-radicals and H-atoms via a series of ion-molecule (e.g., H2 O+ + H2 O → OH + H3O+) or electron-ion (e− + H3O+ → H + H2O) reactions; H2O radiolysis mainly yields OH-radicals and H-atoms as well as some other derivatives, such as H2 and H2 O2 (Buxton 2008). Via the insertion of acetylene in this study, the efficient formation of hydrogenated products, such as C2 H4 and C2 H6, as well as hydroxylated organics (i.e., upon OH-addition), such as vinyl alcohol, is the consequence of these H-atoms and OH-radicals reacting with C2 H2. It is important to note that also ion-molecule reactions might occur along with the H+ penetrating path, but these are beyond the scope of this work. A detailed study on solid-state interaction between ions and molecules under interstellar conditions is still required. Here we focus on the reaction network of C2 H2 interacting with OH-radicals and H-atoms, induced by H+ radiolysis of H2 O ice.
The relative abundances of all observed COMs are shown in Fig. 5, unraveling the possible chemical transformation among vinyl alcohol, acetaldehyde, ketene, and ethanol. In contrast to Fig. 4, the horizontal axis is shown on a logarithmic scale to pinpoint the very initial chemistry upon H+ radiolysis of the C2 H2:H2O mixed ice. As discussed in Sect. 3.2, the acetylene and COM abundance evolution show two distinct formation behaviors, which can be roughly separated at a fluence of ~ 1.5 × 10¹⁴ protons cm−2. At the beginning ofH+ radiolysis, C2 H2 is quickly consumed and converted to vinyl alcohol, and later after passing its maximum yield, the production of acetaldehyde and ethanol takes over. The observed turning point at such fluence is related to the abundance of available C2 H2 in the ice mixture; approximately 50% of the overall C2 H2 depletion (i.e., ΔN(C2H2)) is reached at a fluence of ~1.5 × 10¹⁴ protons cm−2.
Hudson et al. (2003) identified the formation of vinyl alcohol by observing its IR feature at 1145 cm−1, which was first reported in UV-irradiation of C2H2:H2O ice mixture by Wu et al. (2002). The authors proposed the chemical link between vinyl alcohol and C2H2 in ion radiolysis of a C2H2:H2O ice mixture at 15 K. The underlying formation steps have recently been investigated in a non-energetic processing experiment through OH-radicals or H-atoms addition reactions with C2H2 on grain surfaces (Chuang et al. 2020);
 (4a)
(4a)
 (4b)
(4b)
or
 (5a)
(5a)
 (5b)
(5b)
Theoretical calculations show that in the gas phase both association routes require relatively small barriers, such as 5.4–8.0 and 17.99 kJ mol−1 for reactions (4a) and (5a), respectively (Basiuk & Kobayashi 2004; Miller & Klippenstein 2004). The two to three times lower activation energy of reaction (4a) w.r.t. reaction (5a) hints for a preference of vinyl alcohol formation via hydroxylation of C2 H2 followed by H-atom addition reactions (i.e., reactions (4a) and (4b)). Moreover, as suggested in theory and laboratory studies, the newly formed vinyl alcohol can immediately be tautomerized (enol ↔keto) through an “intermolecular” pathway if it is surrounded by other highly catalytic species, such as H2 O, C2 H2, and acids, forming acetaldehyde (Apeloig 1990; Klopman & Andreozzi 1979; da Silva 2010):
 (6)
(6)
In Fig. 5a, the derived product ratio of vinyl alcohol w.r.t. the sum of the other three COMs studied here is shown; N(CH2CHOH)/N(CH2CO + CH3CHO + CH3CH2OH) exhibits a relatively constant value of 1.07 ± 0.15 before a fluence of ~ 1.5 × 10¹⁴ protons cm−2. This implies that the increasing amount of vinyl alcohol is proportional to the total formation yield of ketene, acetaldehyde, and ethanol. Moreover, as shown in Fig. 4, vinyl alcohol is the dominant product at the beginning of the H+ radiolysis. All these results imply that vinyl alcohol acts as a main precursor for the other COMs. The possible conversion reactions are discussed as follows. Besides the isomerization from vinyl alcohol to acetaldehyde, as in reaction (5), the newly formed vinyl alcohol is also expected to be consumed by H2 elimination reactions induced by energetic processes forming ketene (Hudson & Loeffler 2013):
 (7)
(7)
or by hydrogen addition reactions forming ethanol:
 (8)
(8)
Reactions (7) and (8) have been individually proposed in studies by Hudson & Loeffler (2013) and Hudson et al. (2003), respectively. Upon reaching a fluence of ~ 1.5 × 10¹⁴ protons cm−2, the relative abundance of vinyl alcohol over the total yields of ketene, acetaldehyde, and ethanol drops by ~ 67% from 1.10 to 0.36. The depletion time coincides with that of the slowdown of C2 H2 consumption shown in Fig. 4a, confirming that the formation of vinyl alcohol is limited by the available C2 H2 reacting with OH-radicals. Moreover, the conversion from vinyl alcohol to other COMs (i.e., reactions (6)–(8)) is still active, effectively decreasing the ratio between vinyl alcohol and the other detected COMs.
Besides reactions (6)–(8) based on the first-generation product vinyl alcohol, all these newly formed COMs are chemically linked through (de-)hydrogenation. Therefore, the reaction scheme of ketene ↔acetaldehyde ↔ethanol has also been considered to play an indispensable role in further manipulating the product ratio via H-atom addition reactions (also see Fig. 6):
 (9)
(9)
and
 (10)
(10)
or via H-atom abstraction reactions:
 (11)
(11)
and
 (12)
(12)
The non-energetic interactions between H-atoms and acetaldehyde have been experimentally investigated before under dense cloud conditions to validate the reaction network of ketene acetaldehyde
 ethanol (Bisschop et al. 2007; Chuang et al. 2020). It was found that the effective efficiency of abstraction reactions (11) and (12) is generally lower than that of the addition reactions (9) and (10). A similar trend has also been found for the interactions between H-atoms and H2 CO, along the CO-(de)hydrogenation scheme (Hidaka et al. 2007; Chuang et al. 2018). Therefore, these non-energetic dehydrogenation processes are assumed not to affect the complex product composition ratios substantially.
The relative abundances of ketene, acetaldehyde, and ethanol are shown in Fig. 5b. The N(CH2CO)/N(CH3CHO) is enhanced by a factor of ~2, from 0.30 to 0.63 before an H+ fluence of ~ 1.5 × 10¹⁴ protons cm−2. The favored ketene formation route is consistent with an additional formation mechanism (i.e., reaction (7)). Otherwise, the ketene to acetaldehyde ratio should decrease along with the H+ fluence because of the successive conversion from ketene to acetaldehyde (i.e., reaction (9)). An enhancement of the ethanol to acetaldehyde ratio is also found from 0.05 to 0.38 before the H+ fluence of ~ 1.5 × 10¹⁴ protons cm−2, supporting that the H-atom abstraction (i.e., reaction (12)) is a less important reaction. However, it is difficult to distinguish between contributions from reactions (8) and (9) because both can increase the N(CH3CH2OH)/N(CH3CHO) ratio.
Once the C2 H2 conversion to vinyl alcohol slows down, which is clearly observed after reaching the H+ fluence of ~1.5 × 10¹⁴ protons cm−2 in Fig. 4, the ratio of N(CH2CO)/N(CH3CHO) shows a rapid decrease by ~ 80% from 0.63 to 0.13 due to the efficient ketene hydrogenation (i.e., reaction (9)). In contrast, the N(CH3CH2OH)/N(CH3CHO) ratio keeps increasing, from 0.38 to 0.48, but with a much lower efficiency than before. The relative slow increasing rate is probably due to the shortage of vinyl alcohol or the continuous increase of acetaldehyde through reaction (9). Since the contribution of vinyl alcohol to the other three products becomes a minor route, the successive hydrogenation scheme of ketene →acetaldehyde →ethanol further mediates the hydrogen-content of COMs, favoring species such as acetaldehyde and ethanol.
Conversion and composition ratios of products in 200 keV H+ radiolysis of C2H2:H2O mixed ice at 17 K.
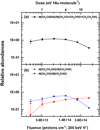 |
Fig. 5 Relative abundances of all observed COMs in the 200 keV H+ radiolysis of C2H2:H2O mixed ice over H+ fluence of 6.0 × 10¹⁴ protons cm−2 (i.e., ~ 16.4 eV 16u-molecule−1). (a) Relative abundances of vinyl alcohol over the total yields of ketene, acetaldehyde, and ethanol. (b) Relative abundances of ketene over acetaldehyde and ethanol over acetaldehyde. The dashed line shows the turning point of product’s formation behavior. The data points are connected by solid lines for clarity. |
5 Astrochemical implication and conclusions
This laboratory study validates a solid reaction network for forming interstellar COMs described by the formula C2 HnO, such as vinyl alcohol, acetaldehyde, ketene, and ethanol, through 200 keV H+ radiolysis of interstellar C2 H2:H2O ice analogs at 17 K. In this work, we extend the recently studied non-energetic chemistry of C2 H2 with OH-radicals and H-atoms to the energetic counterpart triggered by cosmic rays. The initial and newly formed species are monitored in situ in the solid state by IR spectroscopy. The product identifications are further secured using isotope-labeled precursors (i.e., H218O). The quantitative analysis of the depletion of parent C2 H2 and the formation of complex products, which are shown as a function of energy dose, provides information on the involved reaction kinetics. The experimental results are of astronomical relevance to understand the chemistry of unsaturated hydrocarbons deeply buried in H2O ice induced by the continuous cosmic ray impacts along with the evolution of molecular cloud before ice mantle evaporates due to the warming up induced by the protostar.
In the gas phase, C2 H2 has been commonly observed in the circumstellar shell of carbon-rich AGB stars such as IRC+10216, together with its photolysis fragment C2 H, and it also has been abundantly detected toward interstellar clouds (C2 H2/CO = ~10−3), massive young stellar objects (YSOs; C2 H2/H2O = ~(1-5) × 10−2), and protoplanetary disks (C2 H2/H2O = ~1 × 10⁻²) (Keady & Hinkle 1988; Lacy et al. 1989; Cernicharo et al. 1999; Lahuis & van Dishoeck 2000; Carr & Najita 2008). Although the direct observation of icy C2 H2 in the ISM is limited to one observational study by Knez et al. (2008), a solid-state origin of C2 H2 is widely accepted to explain the observed abundance in the gas phase (Sonnentrucker et al. 2007). This is also supported by the observations toward cometary comae, which are regarded as pristine material inherited from interstellar molecular clouds, showing the ratio of C2 H2 over H2O is in the range of (0.2–0.9) × 10−2 (Brooke et al. 1996; Mumma et al. 2003). Alternatively, modeling and laboratory studies proposed a top-down formation mechanism of C2 H2 through surface erosion of hydrogenated amorphous carbonaceous dust (HAC) or photodissociation of ionized polycyclic aromatic hydrocarbons (PAHs) in harsh UV-photons prevailing regions (Jochims et al. 1994; Allain et al. 1996; Le Page et al. 2003; Jäger et al. 2011; Zhen et al. 2014; West et al. 2018).
The investigated solid-state reactions between C2 H2 and H2O radiolysis fragments, such as OH-radicals and H-atoms, are shown as a prevalent pathway transforming the simplest alkyne, C2 H2, to O-bearing COMs in icy environments where H2O is the major constituent of interstellar ices. In translucent clouds (1 ≤ Av ≤ 5), atomic gases, such as H- and O-atoms, accrete on grain surfaces and associate with available species. For example, H2 O ice is mainly formed through the successive H-atom addition reactions to O-atoms:
 (13)
(13)
Other oxygen allotropes (e.g., O2 and O3) have also been investigated in theory and laboratory, showing alternative pathways enriching the solid-state H2 O abundance via the same intermediate OH-radicals (see Fig. 4 in Linnartz et al. 2015). Meanwhile, it has been suggested that OH-radicals can react with hydrocarbons (e.g., alkynes and methyl radicals) or molecules (e.g., CO) forming alcohols and CO2, respectively (Basiuk & Kobayashi 2004; Ioppolo et al. 2011; Qasim et al. 2018). In general, however, most OH-radicals are expectedly transformed into H2O ice, given abundant (atomic and molecular) hydrogen present in molecular clouds (Cuppen & Herbst 2007). Astronomical observations toward various cloud-embedded young stellar objects (YSOs) have shown the H2 O ice is predominant on dust grains and suggested a thick H2O-rich ice layer (tens of monolayer; Boogert et al. 2015). Later, in cold and dense clouds (Av >10, typically within 105 years assuming nH =104 cm−3), CO takes over the gas accreting processes forming an apolar ice layer on top of H2 O ice and increasing the total thickness of ice mantle by a factor ~2 (Boogert et al. 2015). In the rest time of molecular clouds (i.e., 105−7 yr) before thermal sublimation, several simple molecules, which are preserved in the ice mantle, are exclusively irradiated by energetic particles, such as cosmic rays, UV, and X-ray photons. For example, deeply buried H2 O ice covering carbonaceous grain is expected to be dissociated, resulting in OH-radicals and H-atoms. These suprathermal H-atoms and OH-radicals (in the ground or excited states) have been proposed to react with adjacent C2 H2 or C2H actively (Michael et al. 1979; Smith et al. 1984; Senosiain et al. 2005; McKee et al. 2007). These induced hydroxylation (or hydrogenation) reactions to C2 H2 further augment COM yields in the H2O-rich ice layer in addition to the non-energetic scenario prevailing in earlier translucent clouds (Chuang et al. 2020). Moreover, the studied formation network of C2 HnO species starting from C2 H2 is also expected to take place at later stages of star formation, such as midplanes of protoplanetary disks or cometary ices, where C2 H2 has been abundantly identified in H2O-rich ice (Brooke et al. 1996; Altwegg et al. 2019). The chemistry induced by cosmic rays impact is still active at these stages but accounts for different fraction of all energetic inputs.
The investigated interactions of C2 H2 with H-atoms or OH-radicals, which originate from gas-phase accretion (i.e., non-energetic processing on dust grains) or H2 O dissociation (i.e., energetic processing in ice bulks), all lead to qualitatively similar products. In this work, experimental results prove the chemical connections among vinyl alcohol, acetaldehyde, ketene, and ethanol, supporting astronomical observations showing the contemporaneous presence of C2 HnO (n = 2, 4, and 6) species in various astronomical objects. In particular, ketene, acetaldehyde, and ethanol have been jointly identified toward several star-forming regions, comet C/2014 Q2 (Lovejoy), protostars NGC 7129 FIRS 2, SVS13-A, IRAS 16923-2422A and B, Sgr B2(N2), protostellar L1157-B1 shock regions, and even molecular cloud B5 (Bisschop et al. 2007; Fuente et al. 2014; Lefloch et al. 2017; Taquet et al. 2017; Bianchi et al. 2018; Biver & Bockelée-Morvan 2019; Jørgensen et al. 2020; Manigand et al. 2020). Moreover, acetaldehyde and ketene have been abundantly found in dark and dense clouds, such as B1-b and L1689B, as well as in translucent clouds, such as CB 17, CB 24, and CB 228, implying a low-temperature origin for these species (Turner et al. 1999; Bacmann et al. 2012; Cernicharo et al. 2012). A quantitative comparison for all these detections shows that the amounts of acetaldehyde, ketene, and ethanol are quite different in early molecular clouds and collapsing stages; ketene and acetaldehyde are more commonly detected in molecular clouds, while ethanol (the hydrogen-saturated species) is generally the dominant molecule in protostellar objects and cometary ices, that is at later evolutionary stages.
Acetaldehyde and the other two isomers (syn-)vinyl alcohol and ethylene oxide, which have a higher energy by 72.4 and 96 kJ mol−1, respectively,have all been reported in the massive star-forming region Sgr B2N with a suggested abundance ratio of acetaldehyde: vinyl alcohol: ethylene oxide = 800:1:1.5, assuming it is an optically thick source (Turner & Apponi 2001). The uncertainty of the absolute abundance of acetaldehyde has been questioned and remains inconclusive (Ikeda et al. 2001). For low-mass protostars, ethylene oxide has been identified toward IRAS 16923-2422B in the PILS survey1 and towardsthe prestellar core L1689B, concluding that the abundance of acetaldehyde is at least an order of magnitude higher than the value of ethylene oxide (Lykke et al. 2017; Bacmann et al. 2019). An unambiguous detection of vinyl alcohol still lacks in these observations, probably due to relatively weak transitions or chemical instability of vinyl alcohol (enol-keto tautomerization) (Bacmann et al. 2019). Therefore, only upper limits have been reported, namely N(CH3CHO)/N(CH2CHOH) ≥ 9.2 and 35 for L1689B and IRAS 16923-2422B, respectively (Lykke et al. 2017; Bacmann et al. 2019). Also a recent large study strictly searching for vinyl alcohol toward multiple solar-mass protostars has led to setting upper limits (Melosso et al. 2019). These observations consistently point out that acetaldehyde is the most abundant species among the three C2 H4O isomers in star-forming regions. These observations are in line with the present laboratory findings that show an efficient chemical transformation of vinyl alcohol to its chemical derivatives such as ketene, acetaldehyde, and ethanol. The backward conversion from acetaldehyde to vinyl alcohol or ethylene oxide is not favorable due to the high internal energy difference.
The relative amounts of ketene, acetaldehyde, and ethanol as a function of energy dose, observed in this laboratory work, is plotted in the mid-panel of Fig. 7 and further compared to the non-energetic experimental findings of similar C2 H2 interactions with H-atoms and OH-radicals on dust grains. Upon start of H+ radiolysis, around an energy dose of ~0.5 eV 16u-molecule−1, ethanol only contributes to ~4% of the total yield. Acetaldehyde and ketene are present as main products and account for ~ 74 and ~ 22% of the total yield, respectively. Along with accumulating energy, up to a value of 16.4 eV 16u-molecule−1, Fig. 7 clearly shows that hydrogenated species such as ethanol are favored. The composition of ethanol increases by a factor of ~7.3 over ~16.4 eV 16u-molecule−1. In contrast, the ketene contribution remains relatively stable (i.e., 22–31%) before ~ 4.1 eV 16u-molecule−1 due to the competition between formation and destruction mechanisms. Later, it significantly drops when vinyl alcohol is largely reduced. At an energy dose of ~16.4 eV 16u-molecule−1, the final composition is found as ~29% for ethanol, ~63% for acetaldehyde, and ~8% for ketene. A very similar chemical trend favoring hydrogen-rich species has been found in previous non-energetic processing of C2 H2. As shown in the mid-panel of Fig. 7, the derived composition from the C2 H2 + H + OH study is ~51%, ~ 41%, and ~ 8% for ethanol, acetaldehyde, and ketene, respectively, after H-atom fluence reaches ~ 4 × 10¹⁶ atoms cm−2 under the applied experimental conditions. A higher fraction of ethanol is observed and most likely linked to a larger amount of H-atoms originated from the gas-phase accretion, which enhances the hydrogenation channel of acetaldehyde → ethanol. Non-energetic and energetic processing all account for the chemical transformation from unsaturated hydrocarbons to O-bearing COMs under molecular cloud conditions.
In order to estimate the equivalent time required to accumulate the same amount of energy dose under molecular cloud conditions, an approximation is made by assuming monoenergetic 1 MeV protons with a constant flux of 1 proton cm−2 s−1 prevailing insuch regions (Mennella et al. 2003; Palumbo 2006). It is important to note that the accumulated energy dose is conventional units, which stand for the effective energy deposited on each molecule with a mass of 16u. Such units is independent of types of impacting ions and the carrying kinetic energies. Therefore, energy deposited on a 16u-molecule originating from 200 keV H+ is considered as the same as the energy dose from a 1 MeV H+ impinging;
 (14)
(14)
According to Eq. (1), energy dose is the product of stopping power (i.e., S) and ion-fluence (i.e., F = ϕ × t, where ϕ is the flux in ions cm−2 s−1 and t in seconds). Under these assumptions, the 1 MeV proton fluence required to reach the same energy dose in molecular clouds is proportional to the 200 keV H+ fluence in the laboratory. The scaling factors include the ratio of stopping powers (S(200 keV)/S(1 MeV) ≅ 2.78, obtained from SRIM calculation). Therefore, the estimated time in a molecular cloud can be described by the formula (see Palumbo 2006 and Sicilia et al. 2012 for details):
 (15)
(15)
where ϕ(1 MeV) = 1 proton cm−2 s−1.
The derived corresponding timescale stretches from 1.6 × 10⁶ to 5.3 × 10⁷ years shown in the upper horizontal-axis by assuming a cosmic ionization rate of ξCR = 6 × 10⁻¹⁷ s−1 in molecular clouds. This period is close to the typical lifetime of molecular clouds (~ 107 yr; Chevance et al. 2020). It is important to note that interstellar ice analogs studied in this work aim to mimic a H2 O-rich ice mantle in molecular clouds rather than to represent a realistic ice composition containing several (abundant) ice constituents. Therefore, the obtained experimental data demonstrate the chemical transition of favoring hydrogenated species with energy dose accumulation in star-forming regions. The cosmic ray impact onto the ice mantle additionally enhances the internal conversion of newly formed species taking place during the transition stage from molecular clouds to protostars. The studied solid-state chemistry provides a possible explanation for observational discrepancies between dense molecular cloud (left-handed panel of Fig. 7), such as B5, and later stages (right-handed panel of Fig. 7)), such as low-mass protostellar shock region L1157 B1, protostars IRAS 16293-2422A, B, HH 212, B1-c, and S68N, as well as comet C/2014 Q2(Lovejoy) (Lefloch et al. 2017; Taquet et al. 2017; Jørgensen et al. 2018; Biver & Bockelée-Morvan 2019; Lee et al. 2019; van Gelder et al. 2020; Manigand et al. 2020), assuming the net transfer from the solid to gas phase is 1:1 ratio for all COMs. The simultaneous and accumulative effects of non-energetic and energetic processing require further astrochemical modeling in order to simulate solid-state reactions occurring on surfaces and in ice bulks containing realistic chemical compositions covering an astronomical timescale.
Based on the present study on the solid-state chemistry of C2 H2 with OH-radicals and H-atoms in the H+ radiolysis of C2 H2:H2O ice analogs, the main experimental findings can be summarized as below:
- 1.
C2H2 reacting with H-atoms and OH-radicals, produced by H+ radiolysis of H2O ice, forms (semi-)saturated hydrocarbons, such as C2H4 and C2H6, as well ascomplex molecules described by the formula C2HnO, such as vinyl alcohol (CH2CHOH), acetaldehyde (CH3CHO), ketene (CH2CO), and ethanol (CH3CH2OH), on grain surfaces at 17 K;
- 2.
H+ radiolysis experiments on different geometries of C2H2:H2O mixed and layered ices result in qualitatively similar complex molecules, implying that the interface chemistry of H2O ice with unsaturated hydrocarbons on top of dust grains might additionally contribute to COM formation in the solid state;
- 3.
The experimental results show a kinetic evolution of parent C2H2 and the newly formed complex products as a function of exposure energy; the effective destruction cross-section of C2H2 is (1.9 ± 0.5) × 10−15 cm2 per H+ at 200 keV (i.e., 0.07 ± 0.02 eV 16u-molecule−1) and the formation cross-section of the overall two-carbon COMs is (7.2 ± 0.1) × 10−15 cm2 per H+ at 200 keV (i.e., 0.26 ± 0.01 eV/16u-molecule−1). The product composition ratio and conversion efficiency are summarized in Table 2;
- 4.
Experimental results suggest that vinyl alcohol, a species carrying a C=C double bond, is the first-generation product in the H+ radiolysis chemistry of C2H2:H2O, acting as a precursor of other O-bearing COMs. The hydrogenation reactions further increase the hydrogen content of the newly formed species by converting ketene to acetaldehyde or acetaldehyde to ethanol, respectively. A clear transition of the chemical composition is found as a function of energy dose, linking the observational compositions toward dense clouds and later star-forming stages.
The chemistry of the unsaturated hydrocarbons such as alkyne C2 H2 in the current study has been verified in laboratory studies, suggesting an efficient reaction network forming complex organics in interstellar environments (DeMore 1969; Hawkins & Andrews 1983; Hudson & Moore 1997; Hudson & Loeffler 2013; Bennett et al. 2005b; Bergner et al. 2019; Chuang et al. 2020). In addition to the recombination of single carbon containing radicals, such as HCO, CH2OH, and CH3O on grain surfaces, the investigated ice chemistry between hydrocarbons (containing multiple C-atoms through double or triple bond) and atoms (or radicals) offers an additional formation mechanism leading to molecular complexity in the solid state. A similar mechanism is also expected to form N- or S-bearing COMs. A qualitative study focusing on absolute COM yields for different (non-)energetic processing, such as (atoms) fast ions and electrons, as well as the UV and the X-ray photons, is needed to comprehensively reveal the chemical evolution of these interstellar ices at different stages of star-formation.
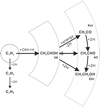 |
Fig. 6 Proposed reaction diagram linking the parent species C2H2 (containing C ≡C bond) and newly formed COMs (containing C=C and C–C bonds) in H+ radiolysis of C2H2:H2O ice mixture. VA: vinyl alcohol; AC: acetaldehyde; Ket: ketene; Eth: ethanol. |
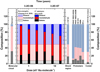 |
Fig. 7 Composition evolution of ethanol, acetaldehyde, and ketene as a function of energy dose in the H+ radiolysis experiment of C2H2:H2O mixed ice at 17 K (middle panel). Here, “time” stands for the approximate years required in dense molecular clouds to reach the same amount of energy dose. The shadow area (in background) reflects the composition ratio in previous non-energetic study obtained from Chuang et al. (2020). The selected observational data toward dense cloud Barnard 5 (left panel), protostellar shock region L1157 B1, protostar IRAS 16293-2422A, B, HH 212, B1-c, and S68N, as well as comet C/2014 Q2(Lovejoy) (right panel), are obtained from Taquet et al. (2017), Lefloch et al. (2017), Manigand et al. (2020), Jørgensen et al. (2018), Lee et al. (2019), van Gelder et al. (2020) and Biver & Bockelée-Morvan (2019) respectively, standing for an early and later stage in the star-formation process. |
Acknowledgements
This work has been supported by the project PRIN-INAF 2016 The Cradle of Life – GENESIS-SKA (General Conditions in Early Planetary Systems for the rise of life with SKA). G.F. acknowledges the financial support from the European Union’s Horizon 2020 research and innovation program under the Marie Sklodowska–Curie grant agreement no. 664931 and from Russian Ministry of Science and Higher Education via the State Assignment Contract FEUZ-2020-0038. Th. H. acknowledges support from the European Research Council under the Horizon 2020 Framework Program via the ERC Advanced Grant Origins 83 24 28. We gratefully acknowledge support by NOVA (the Netherlands Research School for Astronomy), and by NWO, within the framework of the Dutch Astrochemistry Network II and a NWO- VICI grant. This work has been supported by the Danish National Research Foundation through the Center of Excellence “InterCat” (Grant agreement no.: DNRF150).
References
- Abplanalp, M. J., & Kaiser, R. I. 2020, ApJ, 889, 3 [Google Scholar]
- Abplanalpa, M. J., Gozemc, S., Krylovc, A. I., et al. 2016, PNAS, 113, 7727 [Google Scholar]
- Allain, T., Leach, S., & Sedlmayr, E. 1996, A&A, 305, 616 [NASA ADS] [Google Scholar]
- Allamandola, L. J., Sandford, S. A., & Valero, G. J. 1988, Icarus, 76, 225 [NASA ADS] [CrossRef] [Google Scholar]
- Altwegg, K., Balsiger, H., Berthelier, J. J., et al. 2017, MNRAS, 469, S130 [Google Scholar]
- Altwegg, K., Balsiger, H., & Fuselier, S. A. 2019, ARA&A, 57, 113 [NASA ADS] [CrossRef] [Google Scholar]
- Apeloig, Y. 1990, The Chemistry of Enols, ed. Z. Rappoport (Wiley, Chichester: John Wiley & Sons) [Google Scholar]
- Arumainayagam, C. R., Garrod, R. T., Boyer, M. C., et al. 2019, Chem. Soc. Rev., 48, 2293 [Google Scholar]
- Bacmann, A., Taquet, V., Faure, A., Kahane, C., & Ceccarelli, C. 2012, A&A, 541, L12 [NASA ADS] [CrossRef] [EDP Sciences] [Google Scholar]
- Bacmann, A., Faure, A., & Berteaud, J. 2019, ACS Earth Space Chem., 3, 1000 [CrossRef] [Google Scholar]
- Balucani, N., Ceccarelli, C., & Taquet, V. 2015, MNRAS, 449, L16 [Google Scholar]
- Baratta, G. A., & Palumbo, M. E. 1998, J. Opt. Soc. Am. A, 15, 3076 [Google Scholar]
- Baratta, G., Chaput, D., Cottin, H., et al. 2015, Planet. Space Sci., 118, 211 [NASA ADS] [CrossRef] [Google Scholar]
- Barnes, A., & Hallam, H. 1970, Trans. Faraday Soc., 66, 1932 [CrossRef] [Google Scholar]
- Basiuk, V. A., & Kobayashi, K. 2004, Int. J. Quant. Chem., 97, 713 [CrossRef] [Google Scholar]
- Bennett, C. J., Jamieson, C. S., Osamura, Y., & Kaiser, R. I. 2005a, ApJ, 624, 1097 [Google Scholar]
- Bennett, C. J., Osamura, Y., Lebar, M. D., & Kaiser, R. I. 2005b, ApJ, 634, 698 [NASA ADS] [CrossRef] [PubMed] [Google Scholar]
- Bennett, C. J., Jamieson, C. S., Osamura, Y., & Kaiser, R. I. 2006, ApJ, 653, 792 [NASA ADS] [CrossRef] [Google Scholar]
- Berg, O., & Ewing, G. E. 1991, J. Phys. Chem., 95, 2908 [CrossRef] [Google Scholar]
- Bergner, J. B., Öberg, K. I., & Rajappan, M. 2019, ApJ, 874, 115 [NASA ADS] [CrossRef] [Google Scholar]
- Bianchi, E., Codella, C., Ceccarelli, C., et al. 2018, MNRAS, 483, 1850 [Google Scholar]
- Bisschop, S. E., Jørgensen, J. K., van Dishoeck, E. F., & de Wachter, E. B. M. 2007, A&A, 465, 913 [NASA ADS] [CrossRef] [EDP Sciences] [Google Scholar]
- Bisschop, S. E., Jørgensen, J. K., Bourke, T. L., Bottinelli, S., & van Dishoeck, E. F. 2008, A&A, 488, 959 [NASA ADS] [CrossRef] [EDP Sciences] [Google Scholar]
- Biver, N., & Bockelée-Morvan, D. 2019, ACS Earth Space Chem., 3, 1550 [Google Scholar]
- Biver, N., Bockelée-Morvan, D., Debout, V., et al. 2014, A&A, 566, L5 [Google Scholar]
- Boogert, A. C. A., Gerakines, P. A., & Whittet, D. C. B. 2015, ARA&A, 53, 541 [Google Scholar]
- Boudin, N., Schutte, W. A., Greenberg, J. M., et al. 1998, A&A, 331, 749 [Google Scholar]
- Brooke, T., Tokunaga, A., Weaver, H., et al. 1996, Nature, 383, 606 [NASA ADS] [CrossRef] [Google Scholar]
- Buxton, G. V. 2008, Radiation chemistry: from basics to applications in material and life sciences EDP Sciences [Google Scholar]
- Carr, J. S., & Najita, J. R. 2008, Science, 319, 1504 [NASA ADS] [CrossRef] [PubMed] [Google Scholar]
- Cernicharo, J., Yamamura, I., González-Alfonso, E., et al. 1999, ApJ, 526, L41 [NASA ADS] [CrossRef] [PubMed] [Google Scholar]
- Cernicharo, J., Marcelino, N., Roueff, E., et al. 2012, ApJ, 759, L43 [NASA ADS] [CrossRef] [Google Scholar]
- Charnley, S. 2004, Adv. Space Res., 33, 23 [Google Scholar]
- Chevance, M., Kruijssen, J. D., Vazquez-Semadeni, E., et al. 2020, Space Sci. Rev., 216 [Google Scholar]
- Chuang, K.-J., Fedoseev, G., Qasim, D., et al. 2018, ApJ, 853, 102 [NASA ADS] [CrossRef] [Google Scholar]
- Chuang, K.-J., Fedoseev, G., Qasim, D., et al. 2020, A&A, 635, A199 [EDP Sciences] [Google Scholar]
- Cleary, P. A., Romero, M. T. B., Blitz, M. A., et al. 2006, Phys. Chem. Chem. Phys., 8, 5633 [CrossRef] [Google Scholar]
- Compagnini, G., D’Urso, L., Puglisi, O., Baratta, G., & Strazzulla, G. 2009, Carbon, 47, 1605 [CrossRef] [Google Scholar]
- Coutens, A., Persson, M. V., Jørgensen, J. K., Wampfler, S. F., & Lykke, J. M. 2015, A&A, 576, A5 [NASA ADS] [CrossRef] [EDP Sciences] [Google Scholar]
- Cuppen, H., & Herbst, E. 2007, ApJ, 668, 294 [Google Scholar]
- da Silva, G. 2010, Angew. Chem. Int. Ed., 49, 7523 [CrossRef] [Google Scholar]
- DeMore, W. 1969, Int. J. Chem. Kinet., 1, 209 [CrossRef] [Google Scholar]
- Enrique-Romero, J., Rimola, A., Ceccarelli, C., & Balucani, N. 2016, MNRAS, 459, L6 [NASA ADS] [CrossRef] [Google Scholar]
- Enrique-Romero, J., Álvarez-Barcia, S., Kolb, F., et al. 2020, MNRAS, 493, 2523 [CrossRef] [Google Scholar]
- Fuente, A., Cernicharo, J., Caselli, P., et al. 2014, A&A, 568, A65 [NASA ADS] [CrossRef] [EDP Sciences] [Google Scholar]
- Garozzo, M., La Rosa, L., Kanuchova, Z., et al. 2011, A&A, 528, A118 [NASA ADS] [CrossRef] [EDP Sciences] [Google Scholar]
- Gerakines, P. A., Schutte, W. A., Greenberg, J. M., & van Dishoeck, E. F. 1995, A&A, 296, 810 [NASA ADS] [Google Scholar]
- Gomis, O., Leto, G., & Strazzulla, G. 2004, A&A, 420, 405 [NASA ADS] [CrossRef] [EDP Sciences] [Google Scholar]
- Hawkins, M., & Andrews, L. 1983, J. Am. Chem. Soc., 105, 2523 [CrossRef] [Google Scholar]
- Herbst, E. 2017, Int. Rev. Phys. Chem., 36, 287 [CrossRef] [Google Scholar]
- Herbst, E., & van Dishoeck, E. F. 2009, ARA&A, 47, 427 [NASA ADS] [CrossRef] [Google Scholar]
- Hidaka, H., Kouchi, A., & Watanabe, N. 2007, J. Chem. Phys., 126, 204707 [NASA ADS] [CrossRef] [PubMed] [Google Scholar]
- Hiraoka, K., Yamamoto, K., Kihara, Y., Takayama, T., & Sato, T. 1999, ApJ, 514, 524 [NASA ADS] [CrossRef] [Google Scholar]
- Hiraoka, K., Takayama, T., Euchi, A., Hand a, H., & Sato, T. 2000, ApJ, 532, 1029 [NASA ADS] [CrossRef] [Google Scholar]
- Hollenstein, H., & Günthard, H. H. 1971, Spectroch. Acta A: Mol. Spectrosc., 27, 2027 [Google Scholar]
- Hudson, R. L., & Ferrante, R. F. 2020, MNRAS, 492, 283 [NASA ADS] [CrossRef] [Google Scholar]
- Hudson, R. L., & Loeffler, M. J. 2013, ApJ, 773, 109 [NASA ADS] [CrossRef] [Google Scholar]
- Hudson, R., & Moore, M. 1997, Icarus, 126, 233 [NASA ADS] [CrossRef] [Google Scholar]
- Hudson, J. E., Hamilton, M. L., Vallance, C., & Harland, P. W. 2003, Phys. Chem. Chem. Phys., 5, 3162 [CrossRef] [Google Scholar]
- Hudson, R., Ferrante, R., & Moore, M. 2014, Icarus, 228, 276 [Google Scholar]
- Ikeda, M., Ohishi, M., Nummelin, A., et al. 2001, ApJ, 560, 792 [NASA ADS] [CrossRef] [Google Scholar]
- Ioppolo, S., van Boheemen, Y., Cuppen, H. M., van Dishoeck, E. F., & Linnartz, H. 2011, MNRAS, 413, 2281 [Google Scholar]
- Jäger, C., Mutschke, H., Henning, T., & Huisken, F. 2011, EAS Publ. Ser., 46, 293 [Google Scholar]
- Jochims, H., Ruhl, E., Baumgartel, H., Tobita, S., & Leach, S. 1994, ApJ, 420, 307 [NASA ADS] [CrossRef] [Google Scholar]
- Jørgensen, J. K., Favre, C., Bisschop, S. E., et al. 2012, ApJ, 757, L4 [NASA ADS] [CrossRef] [Google Scholar]
- Jørgensen, J. K., van der Wiel, M. H. D., Coutens, A., et al. 2016, A&A, 595, A117 [NASA ADS] [CrossRef] [EDP Sciences] [Google Scholar]
- Jørgensen, J., Müller, H., Calcutt, H., et al. 2018, A&A, 620, A170 [NASA ADS] [CrossRef] [EDP Sciences] [Google Scholar]
- Jørgensen, J. K., Belloche, A., & Garrod, R. T. 2020, ARA&A, 58, 727 [Google Scholar]
- Kaiser, R. I. 2002, Chem. Rev., 102, 1309 [Google Scholar]
- Kaiser, R. I., Maity, S., & Jones, B. M. 2014, Phys. Chem. Chem. Phys., 16, 3399 [Google Scholar]
- Keady, J. J., & Hinkle, K. H. 1988, ApJ, 331, 539 [NASA ADS] [CrossRef] [Google Scholar]
- Khanna, R., Ospina, M. J., & Zhao, G. 1988, Icarus, 73, 527 [NASA ADS] [CrossRef] [Google Scholar]
- Kim, Y., & Kaiser, R. 2009, ApJ, 181, 543 [Google Scholar]
- Klopman, G., & Andreozzi, P. 1979, Bull. Soc. Chim. Belg., 88, 875 [CrossRef] [Google Scholar]
- Knez, C., Moore, M., Travis, S., et al. 2008, Proc. Int. Astron. Union, 4, 47 [CrossRef] [Google Scholar]
- Knez, C., Moore, M., Ferrante, R., & Hudson, R. 2012, ApJ, 748, 95 [NASA ADS] [CrossRef] [Google Scholar]
- Kobayashi, H., Hidaka, H., Lamberts, T., et al. 2017, ApJ, 837, 155 [NASA ADS] [CrossRef] [Google Scholar]
- Koga, Y., Nakanaga, T., Sugawara, K.-i., et al. 1991, J. Mol. Spectrosc., 145, 315 [Google Scholar]
- Lacy, J., Evans, N. J., Achtermann, J., et al. 1989, ApJ, 342, L43 [NASA ADS] [CrossRef] [Google Scholar]
- Lahuis, F. & van Dishoeck, E. 2000, A&A, 355, 699 [Google Scholar]
- Lamberts, T., Markmeyer, M. N., Kolb, F. J., & Kästner, J. 2019, ACS Earth Space Chem., 3, 958 [CrossRef] [Google Scholar]
- Lee, C.-F., Codella, C., Li, Z.-Y., & Liu, S.-Y. 2019, ApJ, 876, 63 [NASA ADS] [CrossRef] [Google Scholar]
- Lefloch, B., Ceccarelli, C., Codella, C., et al. 2017, MNRAS, 469, L73 [NASA ADS] [CrossRef] [Google Scholar]
- Le Page, V., Snow, T. P., & Bierbaum, V. M. 2003, ApJ, 584, 316 [NASA ADS] [CrossRef] [Google Scholar]
- Linnartz, H., Ioppolo, S., & Fedoseev, G. 2015, Int. Rev. Phys. Chem., 34, 205 [CrossRef] [Google Scholar]
- Lo, J.-I., Peng, Y.-C., Chou, S.-L., Lu, H.-C., & Cheng, B.-M. 2020, MNRAS, 499, 543 [Google Scholar]
- Loeffler, M., Raut, U., Vidal, R. A., Baragiola, R., & Carlson, R. 2006, Icarus, 180, 265 [NASA ADS] [CrossRef] [Google Scholar]
- Lykke, J. M., Coutens, A., Jørgensen, J. K., et al. 2017, A&A, 597, A53 [NASA ADS] [CrossRef] [EDP Sciences] [Google Scholar]
- Maity, S., Kaiser, R. I., & Jones, B. M. 2014, ApJ, 789, 36 [NASA ADS] [CrossRef] [Google Scholar]
- Manigand, S., Jørgensen, J., Calcutt, H., et al. 2020, A&A, 635, A48 [NASA ADS] [CrossRef] [EDP Sciences] [Google Scholar]
- McKee, K. W., Blitz, M. A., Cleary, P. A., et al. 2007, J. Phys. Chem. A, 111, 4043 [CrossRef] [Google Scholar]
- Melosso, M., McGuire, B. A., Tamassia, F., Degli Esposti, C., & Dore, L. 2019, ACS Earth Space Chem., 3, 1189 [CrossRef] [Google Scholar]
- Mennella, V., Baratta, G. A., Esposito, A., Ferini, G., & Pendleton, Y. J. 2003, ApJ, 587, 727 [NASA ADS] [CrossRef] [EDP Sciences] [Google Scholar]
- Michael, J., Nava, D., Payne, W., & Stief, L. 1979, J. Chem. Phys., 70, 5222 [NASA ADS] [CrossRef] [Google Scholar]
- Mikawa, Y., Brasch, J., & Jakobsen, R. 1971, Spectrochim. Acta A: Mol. Spectrosc., 27, 529 [Google Scholar]
- Miller, J. A., & Klippenstein, S. J. 2004, Phys. Chem. Chem. Phys., 6, 1192 [CrossRef] [Google Scholar]
- Miller, J. A., & Melius, C. F. 1989 in, Elsevier, 1031–1039 [Google Scholar]
- Milligan, D. E., & Jacox, M. E. 1971, J. Chem. Phys., 54, 927 [NASA ADS] [CrossRef] [Google Scholar]
- Moore, M., & Hudson, R. 1998, Icarus, 135, 518 [NASA ADS] [CrossRef] [Google Scholar]
- Moore, M., & Hudson, R. 2000, Icarus, 145, 282 [NASA ADS] [CrossRef] [Google Scholar]
- Mulas, G., Baratta, G., Palumbo, M., & Strazzulla, G. 1998, A&A, 333, 1025 [Google Scholar]
- Mumma, M., DiSanti, M., Russo, N. D., et al. 2003, Adv. Space Res., 31, 2563 [NASA ADS] [CrossRef] [Google Scholar]
- Necula, A., & Scott, L. T. 2000, J. Am. Chem. Soc., 122, 1548 [Google Scholar]
- Öberg, K. I., Bottinelli, S., Jørgensen, J. K., & van Dishoeck, E. F. 2010, ApJ, 716, 825 [Google Scholar]
- Palumbo, M. 2006, A&A, 453, 903 [NASA ADS] [CrossRef] [EDP Sciences] [MathSciNet] [Google Scholar]
- Pereira, R., de Barros, A., da Costa, C., et al. 2020, MNRAS, 495, 40 [Google Scholar]
- Qasim, D., Chuang, K.-J., Fedoseev, G., et al. 2018, A&A, 612, A83 [NASA ADS] [CrossRef] [EDP Sciences] [Google Scholar]
- Rivilla, V. M., Beltrán, M. T., Cesaroni, R., et al. 2017, A&A, 598, A59 [NASA ADS] [CrossRef] [EDP Sciences] [Google Scholar]
- Rodler, M., Blom, C., & Bauder, A. 1984, J. Am. Chem. Soc., 106, 4029 [CrossRef] [Google Scholar]
- Ryazantsev, S. V., Feldman, V. I., & Khriachtchev, L. 2017, J. Am. Chem. Soc., 139, 9551 [Google Scholar]
- Senosiain, J. P., Klippenstein, S. J., & Miller, J. A. 2005, J. Phys. Chem. A, 109, 6045 [CrossRef] [Google Scholar]
- Shimanouchi, T. 1972, Stand. Ref. Data Ser., 1 [Google Scholar]
- Sicilia, D., Ioppolo, S., Vindigni, T., Baratta, G., & Palumbo, M. E. 2012, A&A, 543, A155 [NASA ADS] [CrossRef] [EDP Sciences] [Google Scholar]
- Smith, G. P., Fairchild, P. W., & Crosley, D. R. 1984, J. Chem. Phys., 81, 2667 [NASA ADS] [CrossRef] [Google Scholar]
- Sonnentrucker, P., González-Alfonso, E., & Neufeld, D. 2007, ApJ, 671, L37 [NASA ADS] [CrossRef] [Google Scholar]
- Strazzulla, G., Baratta, G., & Palumbo, M. 2001, Spectrochim. Acta A: Mol. Biomol. Spectrosc., 57, 825 [Google Scholar]
- Taquet, V., López-Sepulcre, A., Ceccarelli, C., et al. 2015, ApJ, 804, 81 [NASA ADS] [CrossRef] [Google Scholar]
- Taquet, V., Wirström, E. S., & Charnley, S. B. 2016, ApJ, 821, 46 [NASA ADS] [CrossRef] [Google Scholar]
- Taquet, V., Wirström, E., Charnley, S. B., et al. 2017, A&A, 607, A20 [NASA ADS] [CrossRef] [EDP Sciences] [Google Scholar]
- Terwischa van Scheltinga, J., Ligterink, N., Boogert, A., van Dishoeck, E., & Linnartz, H. 2018, A&A, 611, A35 [NASA ADS] [CrossRef] [EDP Sciences] [Google Scholar]
- Tielens, A. G. G. M. 1992, in Tokyo: Univ. Tokyo Press, Vol. 251, Chemistry and Spectroscopy of Interstellar Molecules, ed. N. Kaifu [Google Scholar]
- Tielens, A. 2013, Rev. Mod. Phys., 85, 1021 [Google Scholar]
- Tørneng, E., Nielsen, C., Klaeboe, P., Hopf, H., & Priebe, H. 1980, Spectrochim. Acta A: Mol. Spectrosc., 36, 975 [Google Scholar]
- Turner, B. E., & Apponi, A. J. 2001, ApJ, 561, L207 [NASA ADS] [CrossRef] [Google Scholar]
- Turner, B., Terzieva, R., & Herbst, E. 1999, ApJ, 518, 699 [NASA ADS] [CrossRef] [Google Scholar]
- Urso, R., Scirè, C., Baratta, G., Compagnini, G., & Palumbo, M. E. 2016, A&A, 594, A80 [NASA ADS] [CrossRef] [EDP Sciences] [Google Scholar]
- van Gelder, M., Tabone, B., van Dishoeck, E., et al. 2020, A&A, 639, A87 [CrossRef] [EDP Sciences] [Google Scholar]
- Ward, M. D., & Price, S. D. 2011, ApJ, 741, 121 [NASA ADS] [CrossRef] [Google Scholar]
- Watanabe, N.,& Kouchi, A. 2008, Progr. Surf. Sci., 83, 439 [Google Scholar]
- West, B., Castillo, S. R., Sit, A., et al. 2018, Phys. Chem. Chem. Phys., 20, 7195 [CrossRef] [Google Scholar]
- Wu, C. R., Judge, D., Cheng, B.-M., et al. 2002, Icarus, 156, 456 [NASA ADS] [CrossRef] [Google Scholar]
- Zasimov, P. V., Ryazantsev, S. V., Tyurin, D. A., & Feldman, V. I. 2020, MNRAS, 491, 5140 [Google Scholar]
- Zellner, R., & Lorenz, K. 1984, J. Phys. Chem., 88, 984 [CrossRef] [Google Scholar]
- Zhen, J., Castellanos, P., Paardekooper, D. M., Linnartz, H., & Tielens, A. G. 2014, ApJ, 797, L30 [NASA ADS] [CrossRef] [Google Scholar]
- Zhou, L., Kaiser, R. I., & Tokunaga, A. T. 2009, Planet. Space Sci., 57, 830 [Google Scholar]
- Ziegler, J. F., Biersack, J. P., & Ziegler, M. D. 2011, SRIM: http://www.srim.org [Google Scholar]
All Tables
Conversion and composition ratios of products in 200 keV H+ radiolysis of C2H2:H2O mixed ice at 17 K.
All Figures
|
Fig. 1 IR spectra obtained after (a, black) deposition of C2H2:H2O mixed ice and (b, red) following ion radiolysis by 200 keV H+ at 17 K. The initial deposition ratio of C2H2:H2O mixed ice was 0.4:1, and the applied H+ fluence was 6.0 × 10¹⁴ protons cm−2. IR spectra are offset for clarity. |
| In the text | |
|
Fig. 2 IR spectra obtained after ion bombardment of (a) C2H2:H2O and (b) C2H2:H218O mixed ices by 200 keV H+ at 17 K. The applied deposition ratios were 0.4:1 and 0.2:1 for C2H2:H2O and C2 H2:H218O mixed ices, respectively. The applied H+ fluence for each experiment is 6.0 × 10¹⁴ protons cm−2 (~ 16.4 eV 16u-molecule−1). The blue arrows indicate features that are shifted because of 18O and the dashed lines reflect the absorption features of COMs with 16O. IR spectra are offset for clarity. |
| In the text | |
|
Fig. 3 IR difference spectra obtained before and after 200 keV H+ radiolysis of (a) C2H2:H2O mixed ice along with (b) C2H2:H2O and (c) C2H2:H218O layered ices for the same H+ fluence of 6.0 × 10¹⁴ protons cm−2 (i.e., ~ 16.4 eV 16u-molecule−1) at 17 K. The black arrows followed by dashed lines indicate the absorption peaks of regular COMs with 16O-atoms, and red arrows indicate the absorption peaks of COMs with 18O-atoms. IR spectra are offset for clarity. |
| In the text | |
|
Fig. 4 Abundance evolution of the parent C2H2 species (left panel) and the newly formed reaction products (right panel) in the 200 keV H+ radiolysis of C2H2:H2O mixed ice over H+ fluence of 6.0 × 10¹⁴ protons cm−2 (i.e., ~ 16.4 eV 16u-molecule−1). The derived absolute abundances are normalized to the initial C2H2 abundance. The dashed lines present the fitting results, and the solid lines connecting data are only for clarity. |
| In the text | |
|
Fig. 5 Relative abundances of all observed COMs in the 200 keV H+ radiolysis of C2H2:H2O mixed ice over H+ fluence of 6.0 × 10¹⁴ protons cm−2 (i.e., ~ 16.4 eV 16u-molecule−1). (a) Relative abundances of vinyl alcohol over the total yields of ketene, acetaldehyde, and ethanol. (b) Relative abundances of ketene over acetaldehyde and ethanol over acetaldehyde. The dashed line shows the turning point of product’s formation behavior. The data points are connected by solid lines for clarity. |
| In the text | |
|
Fig. 6 Proposed reaction diagram linking the parent species C2H2 (containing C ≡C bond) and newly formed COMs (containing C=C and C–C bonds) in H+ radiolysis of C2H2:H2O ice mixture. VA: vinyl alcohol; AC: acetaldehyde; Ket: ketene; Eth: ethanol. |
| In the text | |
|
Fig. 7 Composition evolution of ethanol, acetaldehyde, and ketene as a function of energy dose in the H+ radiolysis experiment of C2H2:H2O mixed ice at 17 K (middle panel). Here, “time” stands for the approximate years required in dense molecular clouds to reach the same amount of energy dose. The shadow area (in background) reflects the composition ratio in previous non-energetic study obtained from Chuang et al. (2020). The selected observational data toward dense cloud Barnard 5 (left panel), protostellar shock region L1157 B1, protostar IRAS 16293-2422A, B, HH 212, B1-c, and S68N, as well as comet C/2014 Q2(Lovejoy) (right panel), are obtained from Taquet et al. (2017), Lefloch et al. (2017), Manigand et al. (2020), Jørgensen et al. (2018), Lee et al. (2019), van Gelder et al. (2020) and Biver & Bockelée-Morvan (2019) respectively, standing for an early and later stage in the star-formation process. |
| In the text | |
Current usage metrics show cumulative count of Article Views (full-text article views including HTML views, PDF and ePub downloads, according to the available data) and Abstracts Views on Vision4Press platform.
Data correspond to usage on the plateform after 2015. The current usage metrics is available 48-96 hours after online publication and is updated daily on week days.
Initial download of the metrics may take a while.