Free Access
Fig. 7
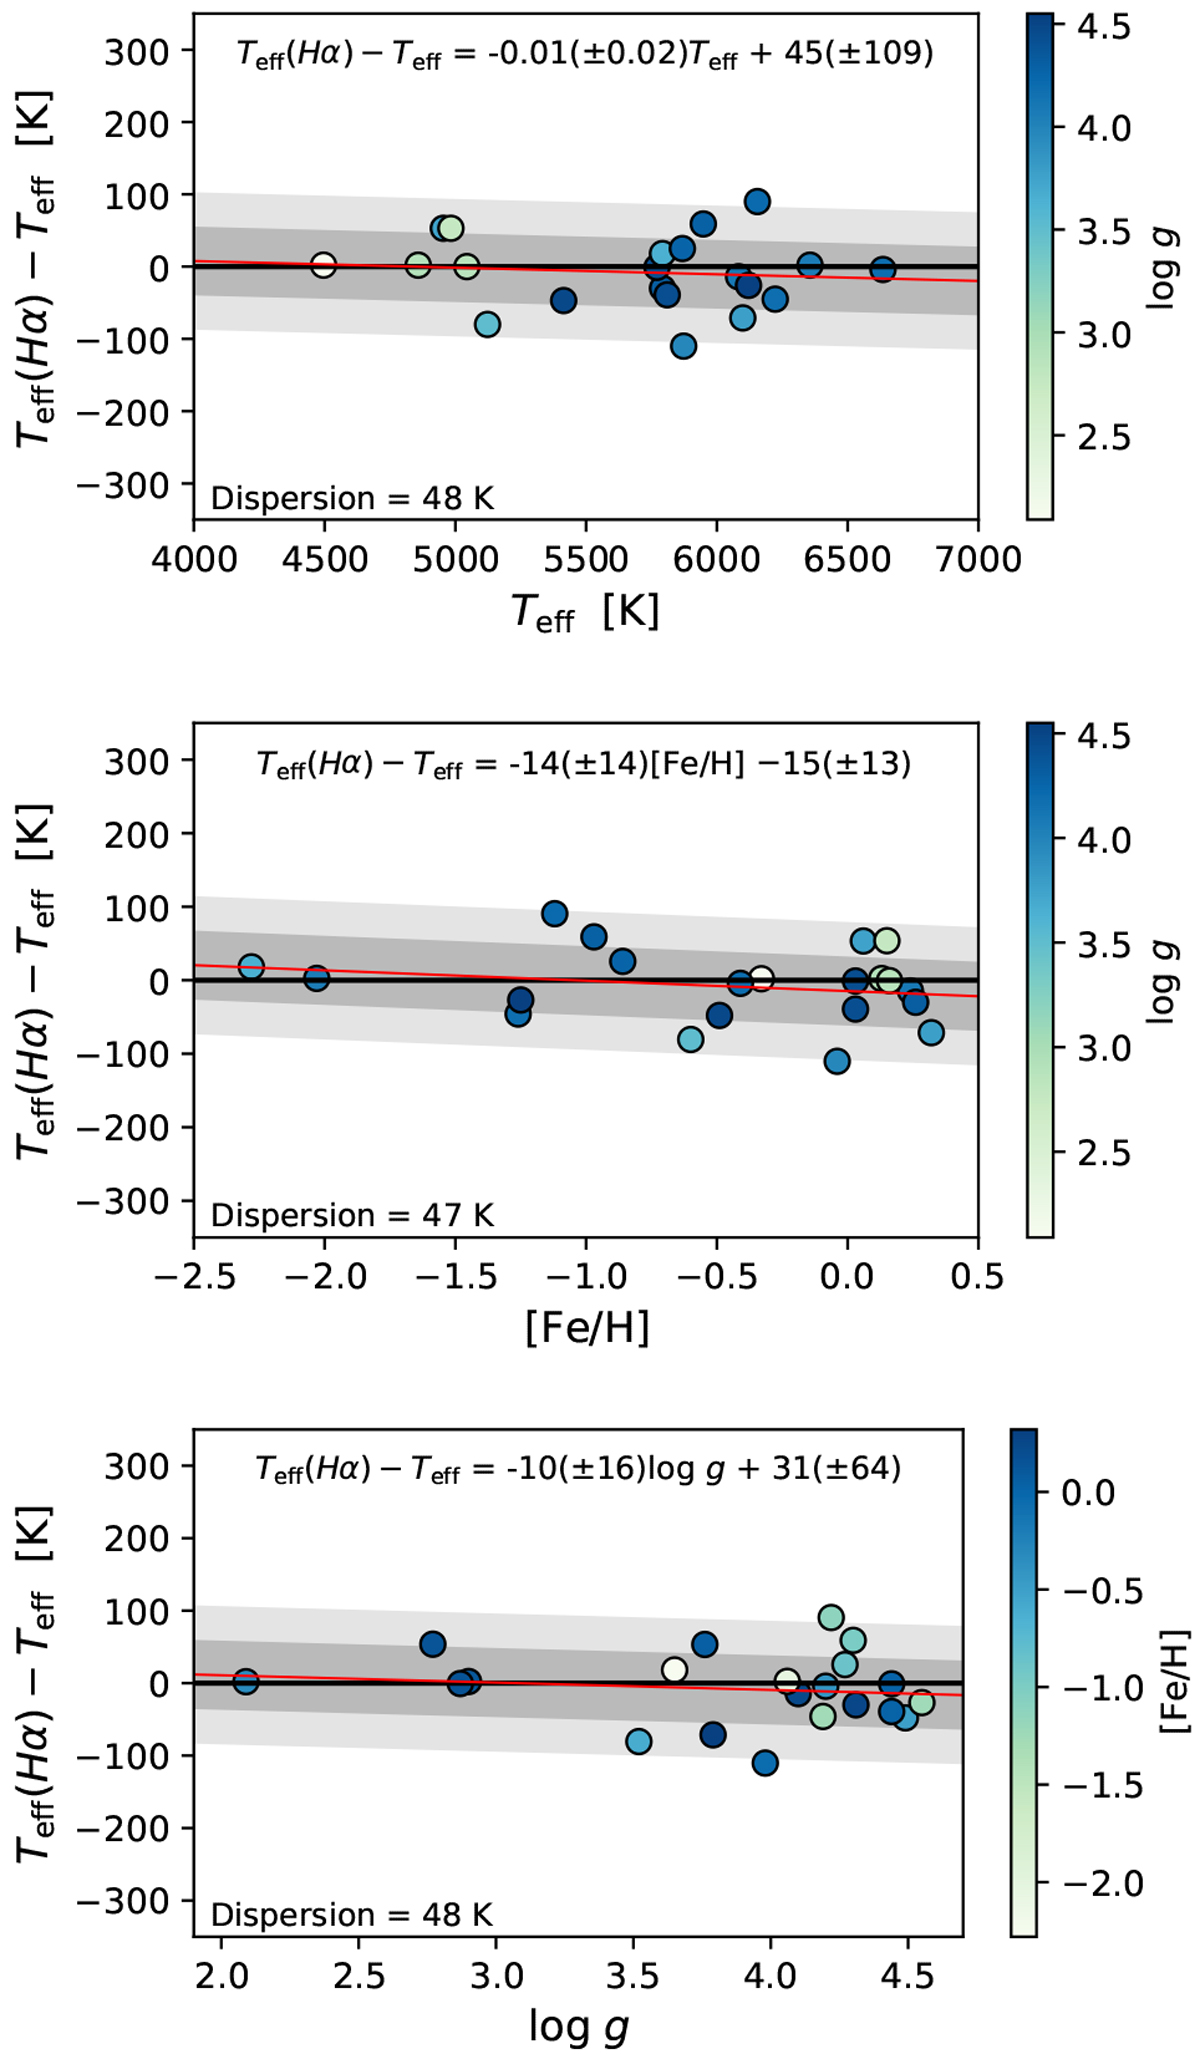
For the GBS of Table 3, difference between Teff(Hα) and the reference Teff as function of the reference Teff, [Fe/H], and log g from the top to the bottom, respectively. The red lines are linear regressions, and the shaded areas indicate 1σ and 2σ dispersions.
Current usage metrics show cumulative count of Article Views (full-text article views including HTML views, PDF and ePub downloads, according to the available data) and Abstracts Views on Vision4Press platform.
Data correspond to usage on the plateform after 2015. The current usage metrics is available 48-96 hours after online publication and is updated daily on week days.
Initial download of the metrics may take a while.