Fig. 6
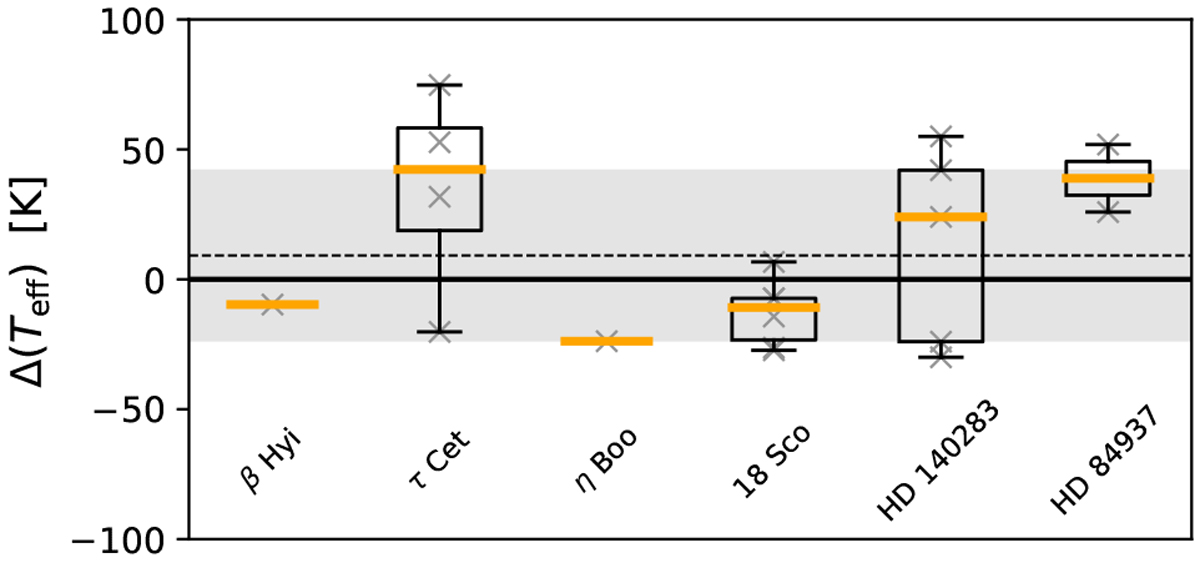
Temperatures derived from UVES spectra relative to the average temperatures derived from HARPS data for each of the GBS labelled in the plot. Grey symbols represent the individual values from multiple spectra. The box-bars extend from the lower to upper quartiles, with an orange line representing the median. The whiskers show the complete range of the values. The dashed line indicates the average difference, + 9 K, and the shaded area encloses the standard deviation of ±33 K.
Current usage metrics show cumulative count of Article Views (full-text article views including HTML views, PDF and ePub downloads, according to the available data) and Abstracts Views on Vision4Press platform.
Data correspond to usage on the plateform after 2015. The current usage metrics is available 48-96 hours after online publication and is updated daily on week days.
Initial download of the metrics may take a while.