Fig. 5
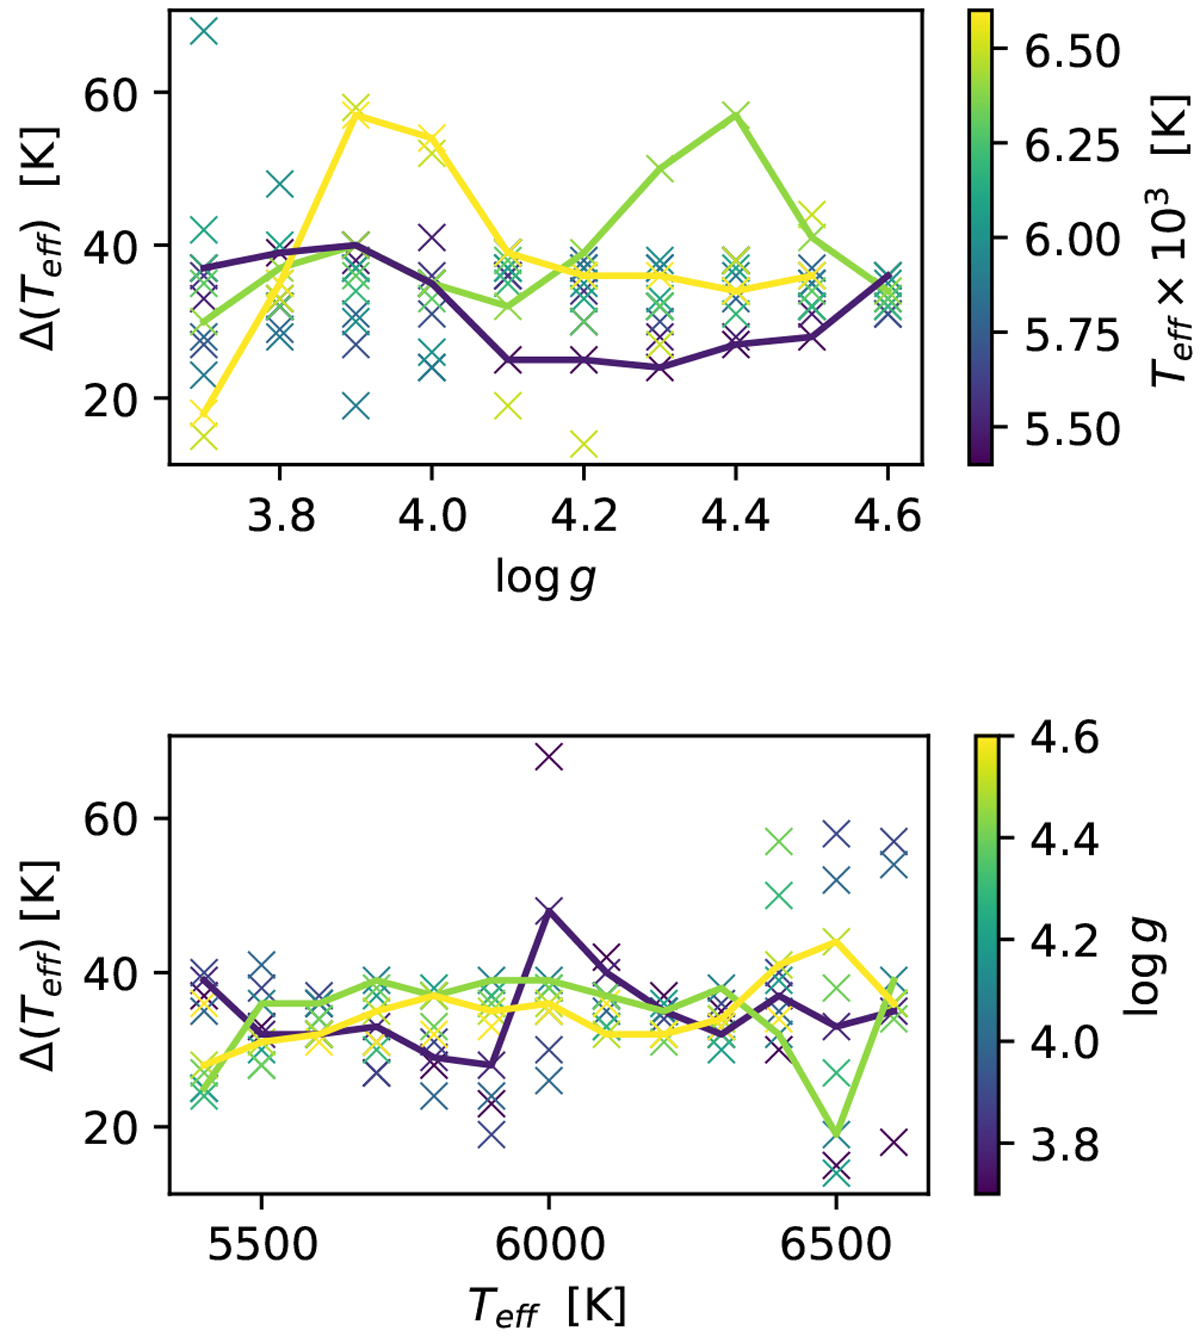
Temperature difference between our best value and the one that is recovered by assuming an offset of − 0.1 dex in log g. The difference is shown as function of log g (top panel) and of the model temperature (bottom panel). In the top panel, cases for 5400, 6400, and 6600 K are highlighted as the lines in blue, green, and yellow, respectively. In the bottom panel, cases for 3.8, 4.1, and 4.5 dex are highlighted as the lines in blue, green, and yellow, respectively.
Current usage metrics show cumulative count of Article Views (full-text article views including HTML views, PDF and ePub downloads, according to the available data) and Abstracts Views on Vision4Press platform.
Data correspond to usage on the plateform after 2015. The current usage metrics is available 48-96 hours after online publication and is updated daily on week days.
Initial download of the metrics may take a while.