Fig. 3
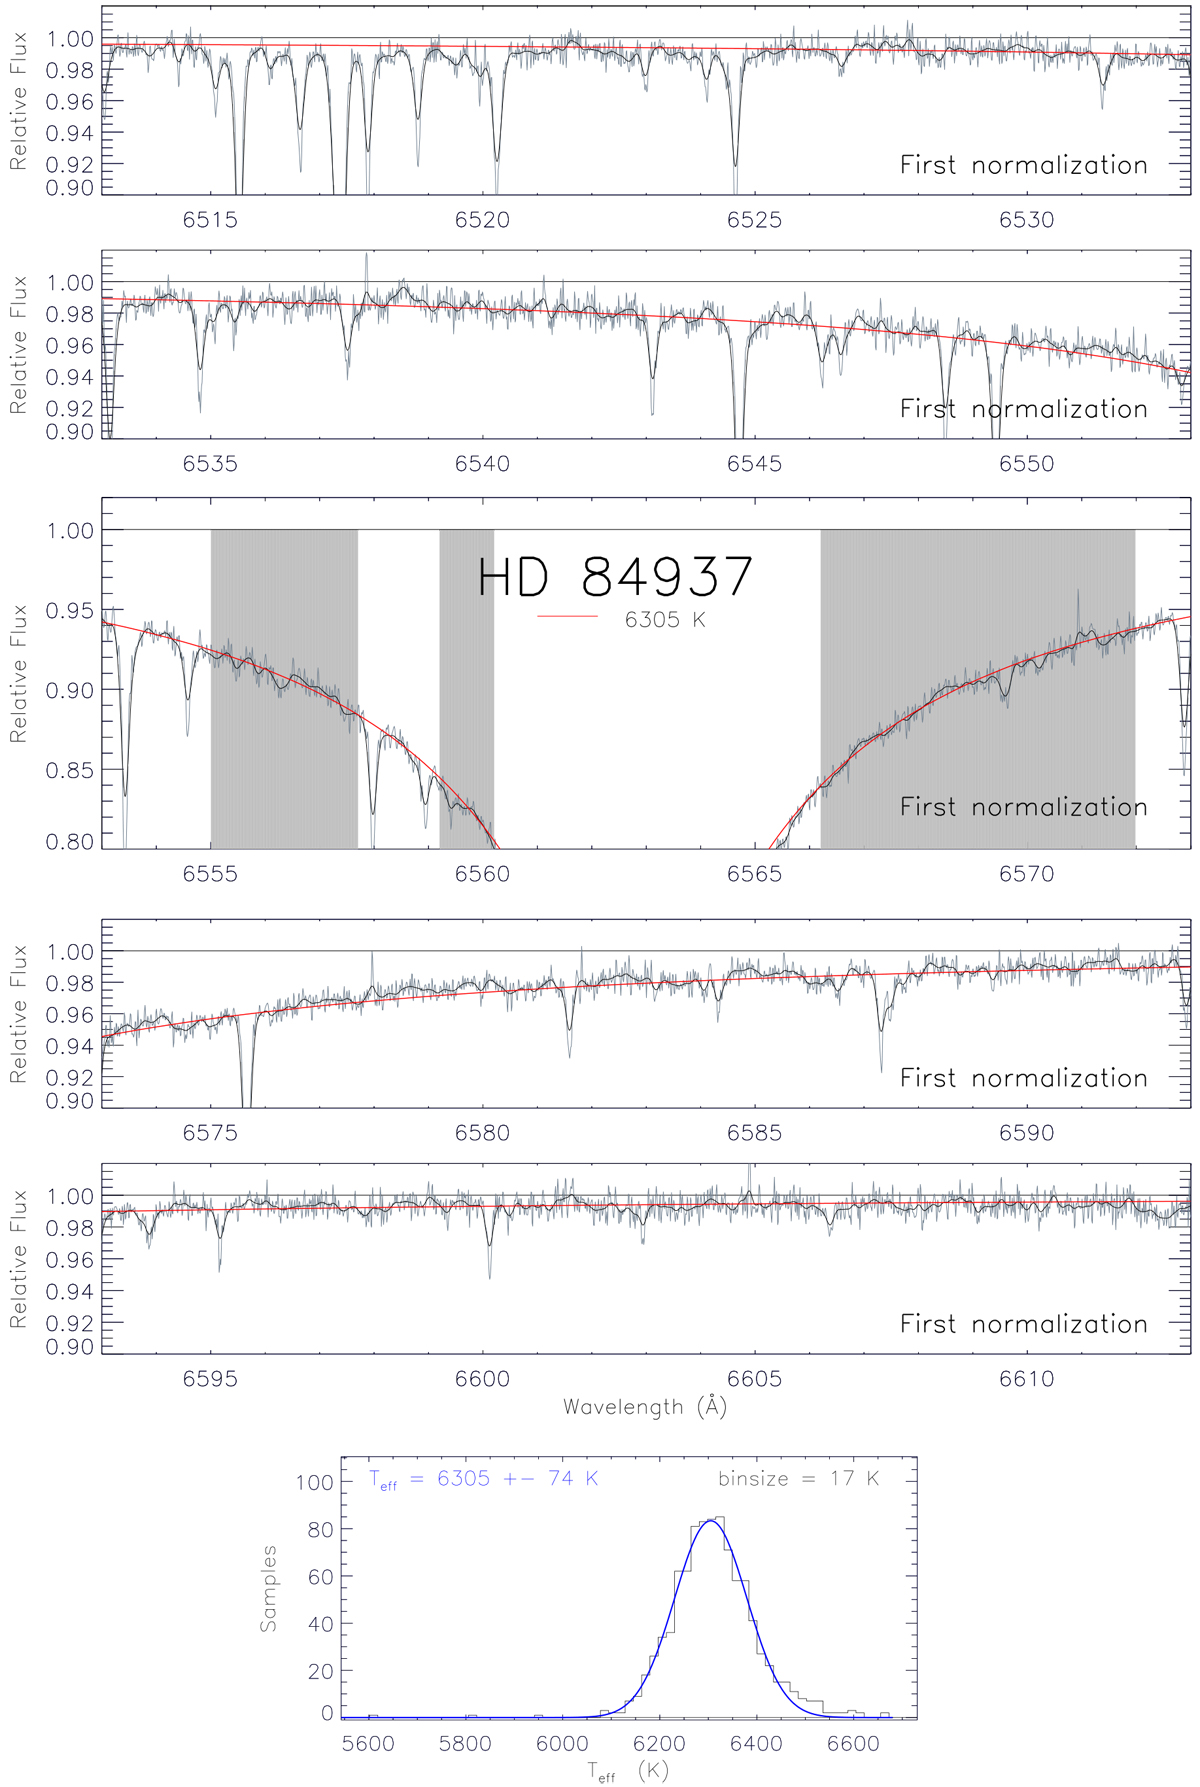
First normalisation-fitting for HD 84937 with HARPS. The spectrum is segmented in pieces of 20 Å to facilitate the visualisation of the details. The original spectrum is plotted in grey, and the black line is the spectrum degraded to facilitate the comparison with the synthetic profile shown in red. The shades are the fitting masks. Bottom panel: Gaussian fitto the histogram of temperatures related to the wavelength bins within the windows represented by the shades.
Current usage metrics show cumulative count of Article Views (full-text article views including HTML views, PDF and ePub downloads, according to the available data) and Abstracts Views on Vision4Press platform.
Data correspond to usage on the plateform after 2015. The current usage metrics is available 48-96 hours after online publication and is updated daily on week days.
Initial download of the metrics may take a while.