Free Access
Fig. 2
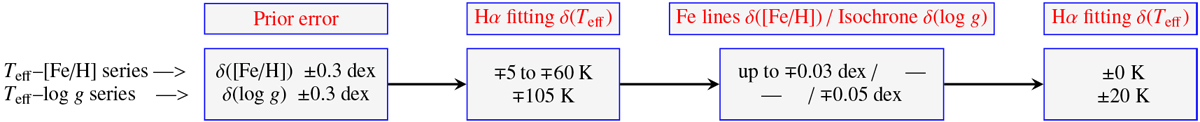
Error flow diagram up to the beginning of the second loop. Each box displays, for each technique, the magnitude of the changes in a certain parameter induced by the variations given for the parameters in the previous box.
Current usage metrics show cumulative count of Article Views (full-text article views including HTML views, PDF and ePub downloads, according to the available data) and Abstracts Views on Vision4Press platform.
Data correspond to usage on the plateform after 2015. The current usage metrics is available 48-96 hours after online publication and is updated daily on week days.
Initial download of the metrics may take a while.