Fig. 10
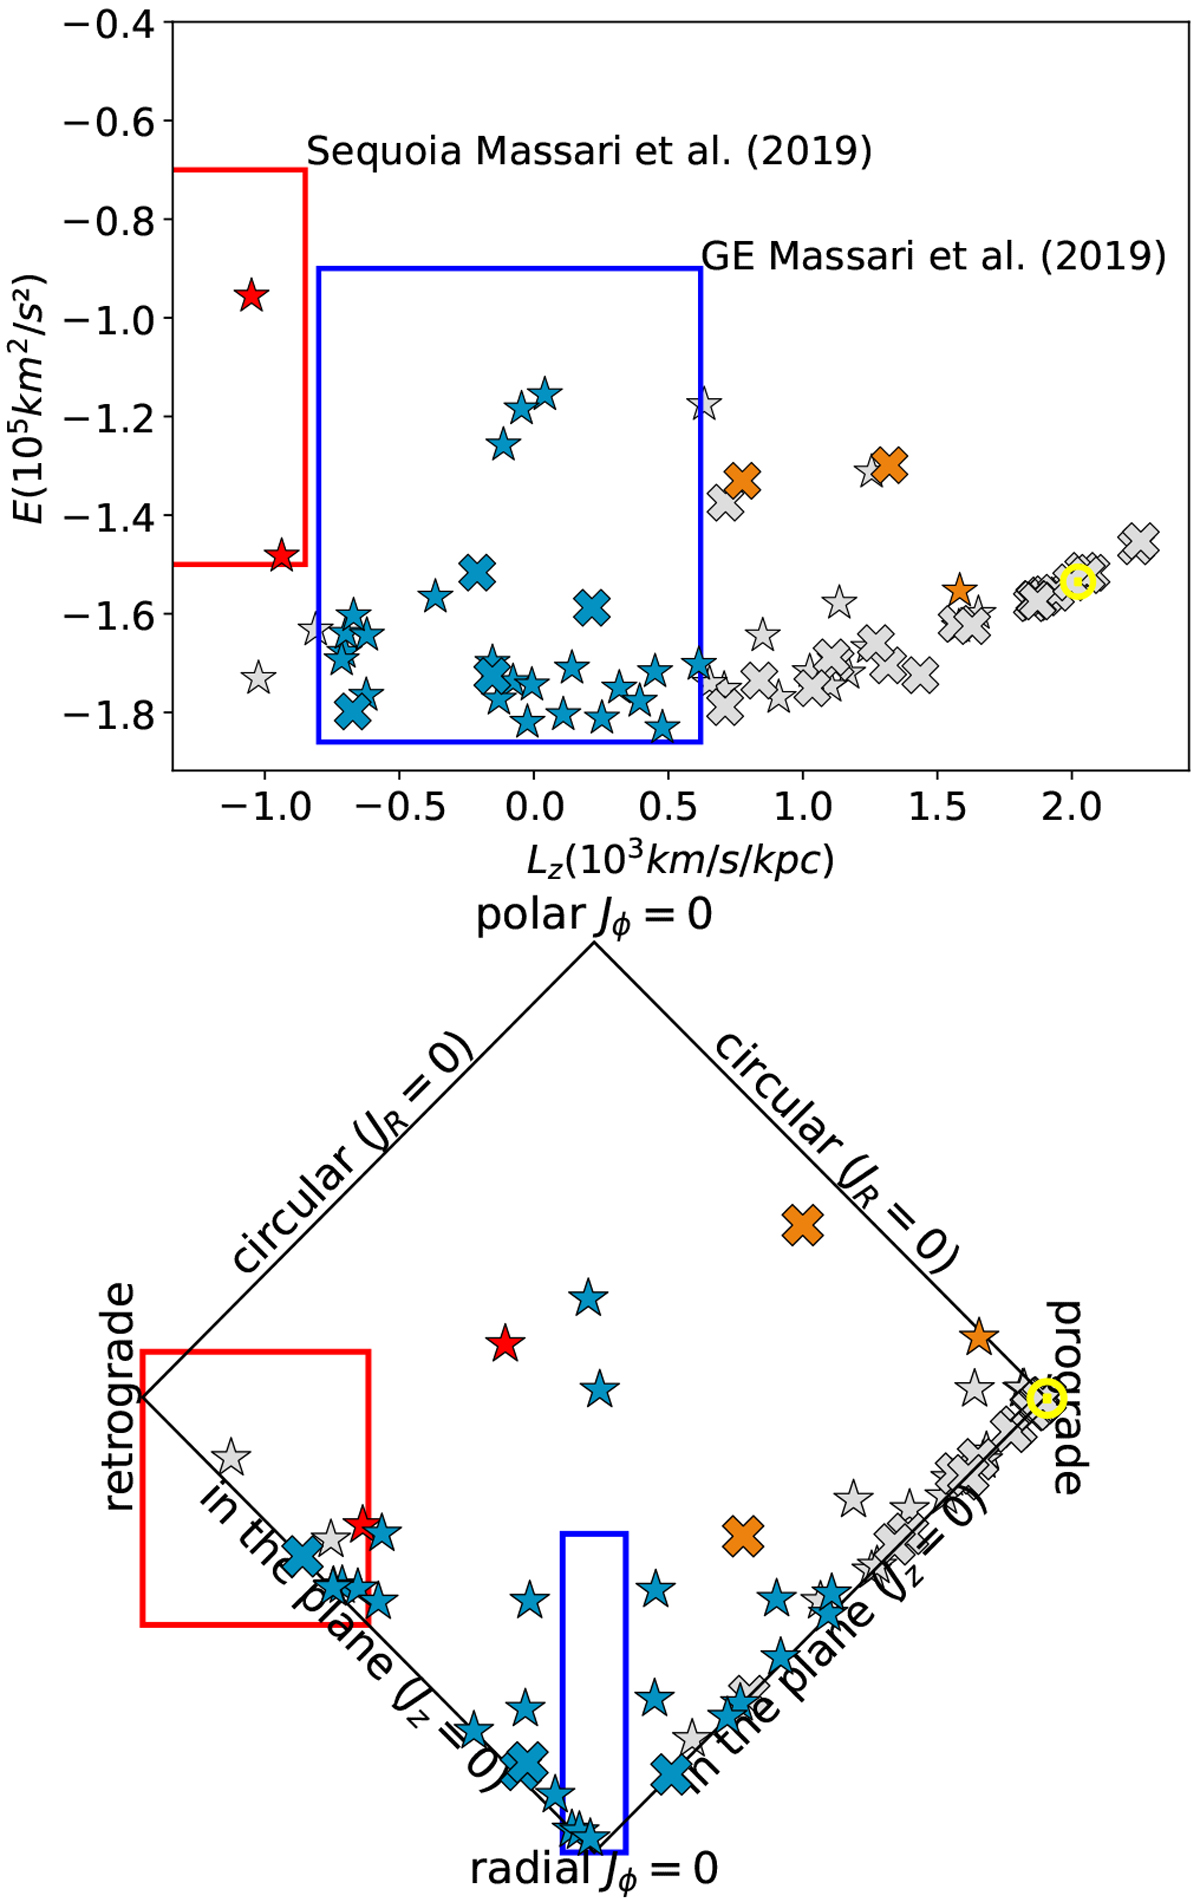
Top: Lindblad diagram – total orbital binding energy as a function of the angular momentum component in the direction of the Galactic north pole. The colours show the Massari et al. (2019) criteria to identifySequoia (the red box and red symbols), Gaia Enceladus (the blue box and blue symbols), and Helmi streams (orange symbols). Unclassified stars are shown in grey. The Sun is shown as the yellow ⊙ symbol. The TITANS are shown as stars and the GBS as crosses. Bottom: action space map – difference of action in the z and r directions by the action in the ϕ direction, all divided by total action (see Fig. 9 in Myeong et al. 2019). The blue box shows the limits for the Gaia-Enceladus merger and the red box shows the limits for Sequoia, according to the Myeong et al. (2019) criteria. The symbols and colours for the stars are the same as in the top panel.
Current usage metrics show cumulative count of Article Views (full-text article views including HTML views, PDF and ePub downloads, according to the available data) and Abstracts Views on Vision4Press platform.
Data correspond to usage on the plateform after 2015. The current usage metrics is available 48-96 hours after online publication and is updated daily on week days.
Initial download of the metrics may take a while.