Free Access
Fig. 9.
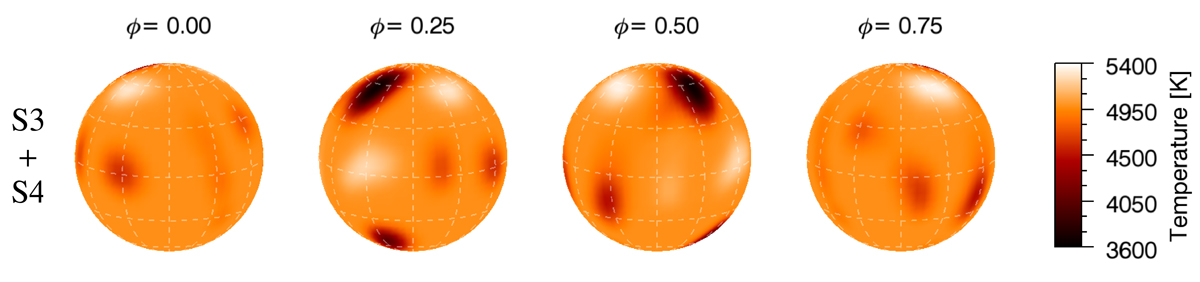
Combined Doppler image of V471 Tau derived from all the spectra in the second observing run at the turn 2014–2015 (S3+S4). The surface temperature map is plotted in four rotational phases.
Current usage metrics show cumulative count of Article Views (full-text article views including HTML views, PDF and ePub downloads, according to the available data) and Abstracts Views on Vision4Press platform.
Data correspond to usage on the plateform after 2015. The current usage metrics is available 48-96 hours after online publication and is updated daily on week days.
Initial download of the metrics may take a while.