Fig. 3.
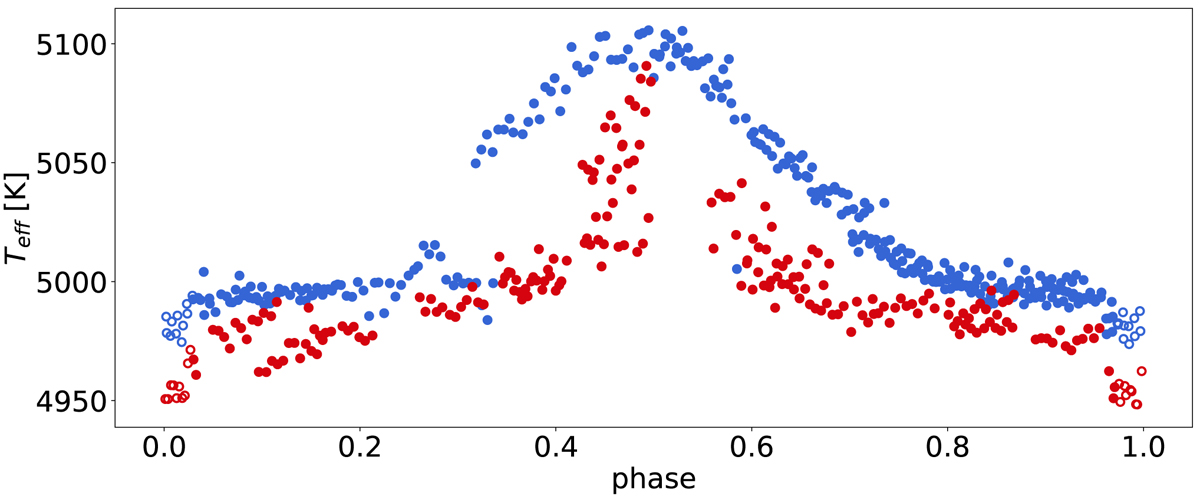
Variation in the surface temperature of the K2 star along the orbital phase. The dots show the temperature values derived individually for each spectra (blue for the 2005 season, red for the 2014–2015 spectra) by spectral synthesis. Open circles around zero phase correspond to those unaffected spectra that were observed when the white dwarf was eclipsed. The temperature rise of ≈100 K at ϕ ≈ 0.5 in both seasons may indicate the irradiation effect of the hot component (see Sect. 3.2 for details).
Current usage metrics show cumulative count of Article Views (full-text article views including HTML views, PDF and ePub downloads, according to the available data) and Abstracts Views on Vision4Press platform.
Data correspond to usage on the plateform after 2015. The current usage metrics is available 48-96 hours after online publication and is updated daily on week days.
Initial download of the metrics may take a while.