Free Access
Fig. 2.
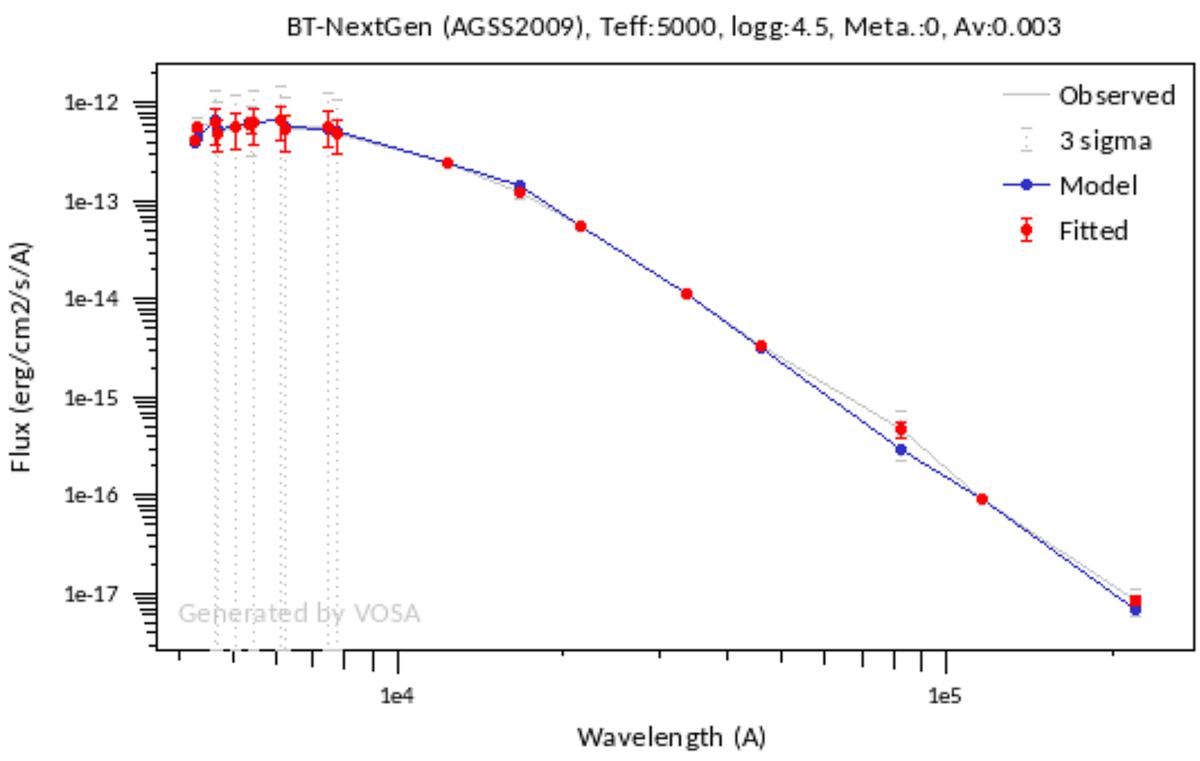
Spectral energy distribution for V471 Tau generated by the VOSA SED analyzer tool (Bayo et al. 2008). The synthetic spectrum (blue line) is fitted to the available archival photometry (red dots) from the Tycho, SLOAN/SDSS, Gaia DR2, 2MASS, AKARI/IRC, and WISE surveys.
Current usage metrics show cumulative count of Article Views (full-text article views including HTML views, PDF and ePub downloads, according to the available data) and Abstracts Views on Vision4Press platform.
Data correspond to usage on the plateform after 2015. The current usage metrics is available 48-96 hours after online publication and is updated daily on week days.
Initial download of the metrics may take a while.