Fig. 13.
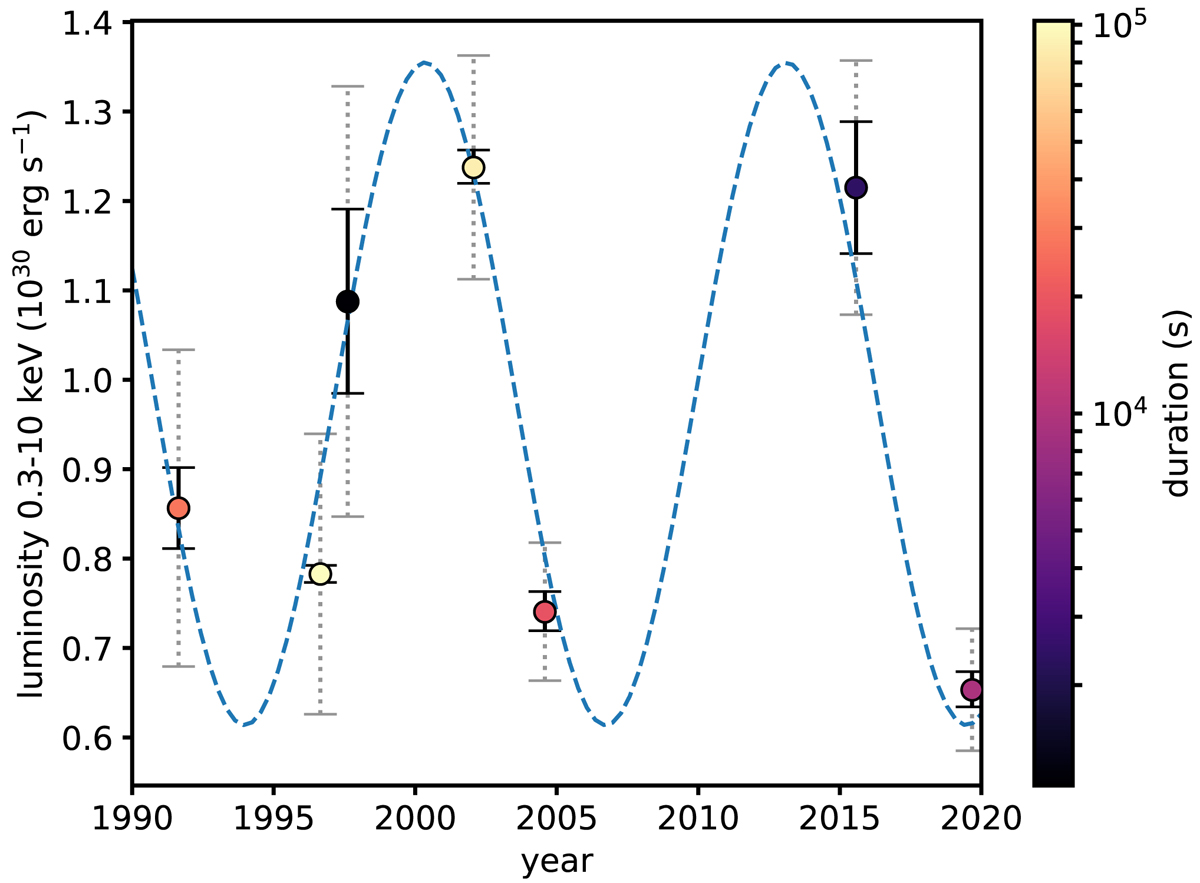
Evolution of the X-ray luminosity of the K dwarf in V471 Tau from the observations summarized in Table 1. The duration of the selected quiescent ranges is color-coded. Solid error bars denote flux errors (see text); dotted bars are the estimated cross-calibration uncertainty. The blue dashed line indicates the best fit with a sinusoidal function with a period of ∼12.7 yr.
Current usage metrics show cumulative count of Article Views (full-text article views including HTML views, PDF and ePub downloads, according to the available data) and Abstracts Views on Vision4Press platform.
Data correspond to usage on the plateform after 2015. The current usage metrics is available 48-96 hours after online publication and is updated daily on week days.
Initial download of the metrics may take a while.