Fig. 11.
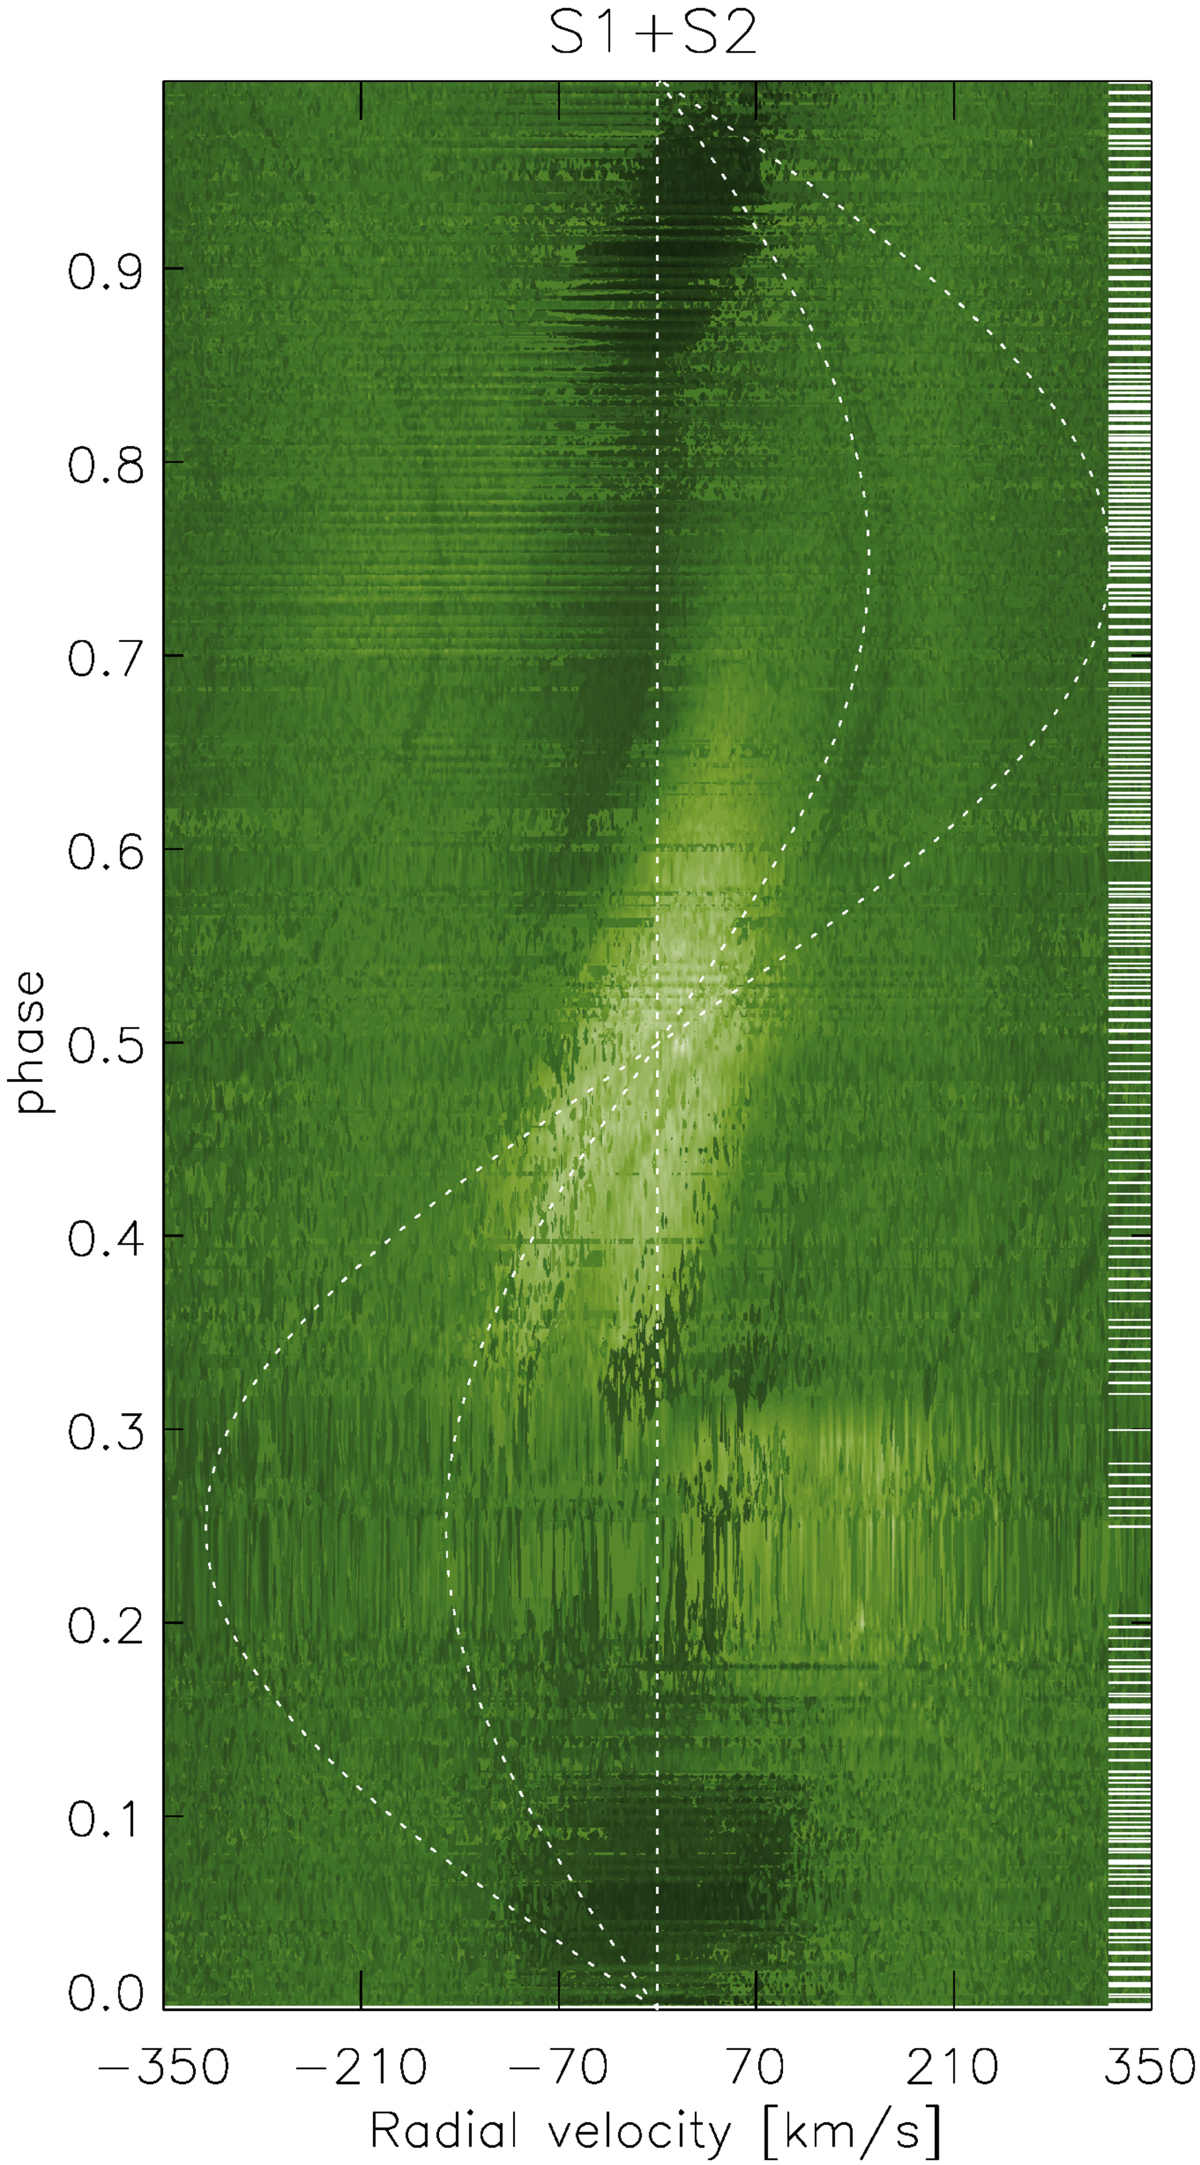
Dynamic Hα spectrum from the 2005 data (S1+S2). The individual 1D Hα spectra along the orbital phase are plotted in the rest frame of the K star. Dark green corresponds to deep absorption, while light yellow indicates strong emission. The large amplitude (≈320 km s−1) sine curve is the radial velocity of the white dwarf; the smaller amplitude (≈150 km s−1) sinusoid is the radial velocity of the centre of mass of the binary system. The tick marks on the right indicate the phases of the observations.
Current usage metrics show cumulative count of Article Views (full-text article views including HTML views, PDF and ePub downloads, according to the available data) and Abstracts Views on Vision4Press platform.
Data correspond to usage on the plateform after 2015. The current usage metrics is available 48-96 hours after online publication and is updated daily on week days.
Initial download of the metrics may take a while.