| Issue |
A&A
Volume 650, June 2021
|
|
|---|---|---|
| Article Number | A52 | |
| Number of page(s) | 5 | |
| Section | Galactic structure, stellar clusters and populations | |
| DOI | https://doi.org/10.1051/0004-6361/202140643 | |
| Published online | 07 June 2021 | |
The kinematics of Small Magellanic Cloud star clusters
1
Instituto Interdisciplinario de Ciencias Básicas (ICB), CONICET-UNCUYO, Padre J. Contreras 1300, M5502JMA Mendoza, Argentina
e-mail: This email address is being protected from spambots. You need JavaScript enabled to view it.
2
Consejo Nacional de Investigaciones Científicas y Técnicas (CONICET), Godoy Cruz 2290, C1425FQB Buenos Aires, Argentina
Received:
23
February
2021
Accepted:
7
April
2021
Abstract
We report results of the proper motions of 25 known Small Magellanic Cloud (SMC) clusters (ages ∼ 1–10 Gyr old) derived from Gaia EDR3 data sets. When these mean proper motions were gathered with existent radial velocity measurements to compose the clusters’ velocity vectors, we found the parameter values of a rotation disk that best resemble their observed motions, namely: central coordinates and distance, inclination and position angle of the line-of-nodes, proper motion in right ascension and declination, systemic velocity, rotation velocity, and velocity dispersion. The SMC cluster rotation disk seems to be, at some level, kinematically synchronized with the rotation of the field red giants recently modeled using DR2 data sets. Such a rotation disk is seen in the sky as a tilted edge-on disk, with a velocity dispersion perpendicular to it that is twice as large as that in the plane of the disk. Because the direction perpendicular to the disk is nearly aligned with the Magellanic Bridge, we interpret the larger velocity dispersion as a consequence of the SMC velocity stretching caused by the tidal interaction with the Large Magellanic Cloud. Rotation alone does not seem sufficient to explain the observed kinematic behaviors in the SMC.
Key words: galaxies: individual: SMC / galaxies: star clusters: general
© ESO 2021
1. Introduction
In recent years, various efforts have been made to accurately trace the internal kinematic behavior of the Small Magellanic Cloud (SMC; see, e.g., Niederhofer et al. 2018; Zivick et al. 2018; Di Teodoro et al. 2019, and references therein). Radial velocity-only analysis and surveys based on proper motion measurements, as well as other studies that complemented both types of kinematic information, have arrived, to some extent, at different results. Although there is a general consensus about the presence of tidal effects from the Large Magellanic Cloud (LMC), the magnitude of such a tidal disruption turns out to be different depending on the stellar population examined (De Leo et al. 2020; Zivick et al. 2021; Niederhofer et al. 2021). Furthermore, an ordered SMC disk rotation kinematics is nowadays a matter of debate. Indeed, while De Leo et al. (2020) and Niederhofer et al. (2021) do not detect any signature of rotation, Zivick et al. (2021) find a moderate rotational motion.
As far as we are aware, star clusters have not been used as tracers of the SMC internal kinematics. However, they are advantageous from different points of view. Their mean radial velocities and proper motions come from the average of measurements of several cluster members, resulting in values based on robust statistics. They are also suitable representatives of the internal motion of the SMC, as compared with the mean radial velocities and proper motions of stars aligned along different lines-of-sight across the SMC. This is also valid even when dealing with different field stellar populations that are analyzed separately. On the other hand, star clusters are accurately aged such that the internal motion of the SMC can be easily linked to the star cluster metallicities, thus providing a comprehensive framework for our understanding of the formation and chemico-dynamical evolution history of the galaxy.
In this work we uncovered, for the first time, the ongoing internal motion of the SMC as seen by its population of star clusters that have ages older than ∼1 Gyr. We built a 3D picture of the cluster movements from the Gaia Early Data Release (Gaia EDR3; Gaia Collaboration 2016, 2021) and radial velocities gathered from the literature to construct their space velocity vectors. By analyzing these space velocity components we find that the SMC can be described as a rotating edge-on disk that is experiencing a stretching process nearly perpendicular to it, in the direction toward the LMC. The article is organized as follows: In Sect. 2 we describe the collected Gaia EDR3 data sets for the star cluster sample, and perform a rigorous selection of cluster members and estimate the mean star cluster proper motions. Section 3 deals with the analysis of the space velocity components and discusses the results in light of recent findings in this field.
2. Collected data and mean cluster proper motions
We started by searching the literature for radial velocity studies of SMC star clusters and found that Da Costa & Hatzidimitriou (1998), Parisi et al. (2009, 2015), and Kamann et al. (2018) derived mean radial velocities for a total of 31 clusters. Then, we used the cluster catalog compiled by Bica et al. (2020) to extract the right ascension, declination, size, age, and metallicity for those star clusters with radial velocity studies (see also Piatti 2021). From Gaia EDR31, we extracted parallaxes (ϖ), proper motions in right ascension (pmra) and declination (pmdec), excess noise (epsi), the significance of excess of noise (sepsi), and G, BP, and RP magnitudes for stars located within a radius equal to three times the cluster radius from the respective cluster center. We limited our sample to stars with proper motion errors ≤0.1 mas yr−1, following the suggestion by Piatti et al. (2019, and reference therein), who found that the larger the individual proper motion errors of LMC stars, the larger the derived errors of the mean LMC cluster proper motions. We minimized the presence of foreground stars by favoring distant stars (i.e., |ϖ|/σ(ϖ) < 3) and pruned the data with sepsi < 2 and epsi < 1, which define a good balance between data quality and the number of retained objects for our sample (see also Ripepi et al. 2019). We built color-magnitude diagrams (CMDs) of the selected stars and found a limiting magnitude of G ≲ 18.0 mag. At the mean SMC distance (see, e.g., Graczyk et al. 2020), this limit corresponds to nearly the base of the red giant branch.
In order to statistically clean the cluster vector-point diagrams (VPDs) from the SMC field star contamination, we employed a procedure originally devised to decontaminate cluster CMDs (Piatti & Bica 2012), which was satisfactorily applied in cleaning the CMDs of star clusters projected toward crowded star fields (e.g., Piatti 2017b,c,a, and references therein) and affected by differential reddening (e.g., Piatti 2018; Piatti et al. 2018, and references therein). The method basically consists in using a circular star field located close to the cluster field, which is also delimited by a circle, then building its respective VPD and finally subtracting it from the cluster VPD. Figure 1 illustrates, as an example, the distribution of six star fields around NGC 339, superimposed on the stars that comply with the above selection criteria. The cluster circle, centered on the cluster and with a radius equal to the cluster radius, and the six adjacent star field circles have the same area. The six adjacent star fields are used one at a time, thus repeating the cleaning procedure to improve the statistics.
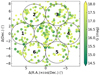 |
Fig. 1. Selected Gaia EDR3 stars distributed in the field of NGC 339. The cluster circle and six adjacent star field circles of equal size are drawn. The size of the symbols is proportional to the star brightness (G mag). |
We subtracted from the cluster field a number of stars equal to that in the adjacent star field. The method defines boxes in the star field VPD centered on each star, then superimposes all the boxes on the cluster VPD, and chooses one star per box to subtract. With the aim of avoiding stochastic effects caused by very few boxes distributed in some VPD regions, variable box sizes were used. In the case that more than one star was located inside a box, the closest one to its center was subtracted. The positions in the cluster field of the subtracted stars were chosen randomly within small boxes, the sides of which were equal to 10% of the cluster radius. We iterated this search up to a thousand times throughout the cluster field. The proper motion errors of the stars in the cluster field were also taken into account while searching for a star to subtract from the cluster VPD. With that purpose, we iterated the search for each VPD box up to a thousand times, allowing the proper motions of the stars in the cluster VPD to vary within an interval of ±1σ, where σ represents the errors in the proper motions. For the sake of the reader, Figure 2 shows both the resulting cleaned cluster VPD and cluster field using different adjacent star fields.
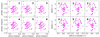 |
Fig. 2. VPD (left panels) and cluster field (right panels) of NGC 339. The labels indicate the adjacent star field used to clean the cluster VPD. Magenta symbols represent the stars that remained un-subtracted after the cleaning procedure. |
We assigned a membership probability to each star in the cluster field as P (%) = 100 × S/6, where S represents the number of times the star was not subtracted after the six different VPD cleaning executions. With that information on hand, we built Fig. 3 to illustrate the VPD of all the selected stars located in the field of NGC 339. Stars with different probability (P) values were plotted with different colors. We checked the distribution of the stars along the cluster red giant branch using the Gaia EDR3 photometry and kept only those with P > 50%. Table 1 lists 25 SMC clusters that passed all the cleaning and selection procedures, as well as the respective number (N) of stars. Other clusters (HW 40, 47, 67, L 11, 13, and 108) were also analyzed, and no star remained at the end of the above analysis.
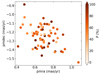 |
Fig. 3. VPD for selected Gaia EDR3 stars distributed in the field of NGC 339, colored according to the assigned membership probability. |
Proper motions of SMC star clusters.
We finally performed maximum likelihood statistics (Pryor & Meylan 1993; Walker et al. 2006) in order to estimate the mean proper motions and dispersion for the cluster sample. We optimized the probability, ℒ, that a given ensemble of stars with proper motions, pmi, and errors, σi, are drawn from a population with mean proper motion, ⟨pm⟩, and dispersion, W, as follows:
where the errors on the mean and dispersion were computed from the respective covariance matrices. We applied the above procedure for pmra and pmdec separately. The resulting mean values are listed in Table 1.
3. Analysis and discussion
Zivick et al. (2021) obtained the best-fit parameters of a rotation disk that represents the kinematics of SMC field red giants by using Gaia DR2 data, radial velocities from the literature, and the transformation Eqs. (9), (13), and (21) in van der Marel et al. (2002; see also Piatti et al. 2019) as a function of the position angle, measured from north to east. We followed a similar procedure here by searching for the kinematic model that best represents the motion of our cluster sample. The modeled rotation disk is characterized by the right ascension and declination of its center, its distance, radial velocity, pmra, pmdec, the inclination of the disk, the position angle of the line-of-nodes (LON), and the rotational velocity. Velocity dispersions along the three independent axes were also taken into account. In order to derive their best representative values, we allowed the velocity dispersions to vary in fixed ranges, as shown in Table 2. For each possible combination of the parameter values, we computed the rotational velocity components v1, v2, and v3 (see van der Marel et al. 2002) as a function of the position angle of a point placed on a disk at a distance s to its center. From the grid chosen in the parameter space, we generated more than 5.3 × 10⁸ different curves each for v1, v2, and v3, from which we extracted the values corresponding to the clusters’ position angles.
SMC disk rotation parameters.
On the other hand, we calculated the rotational velocity components for the cluster sample using the mean cluster radial velocities and proper motions as well as the above combinations of disk parameters (see Piatti et al. 2019). Regarding units, we used [km s−1] = 4.7403885*Do [mas yr−1], where Do is the distance to the SMC center. We then compared the 25 resulting (v1, v2, v3) vectors with those calculated above (those corresponding to the disk) by adding the three velocity component differences (Δvi, i = 1, 2, 3) per cluster (absolute values) and by deriving the respective average value (Δv) and dispersion (σ(Δv)) for the whole cluster sample. We note that although Δv and ( (Δvi)2)1/2 have different statistical properties, the result of using one or the other turns out to be very similar. We repeated this procedure for each of the above combinations of parameter values and looked for the parameter set with the minimum average difference (Δvmin ± σ(Δvmin)), which we adopted as the best representation to describe the rotation of the studied SMC clusters. We then considered Δv values in the interval [Δvmin − σ(Δvmin); Δvmin + σ(Δvmin)] and their respective parameter values. The resulting parameter ranges were adopted as their uncertainties. The adopted parameters and their uncertainties are listed in the last column of Table 2.
Figure 4 depicts the three velocity components as a function of the position angle for the cluster sample calculated using their mean proper motions and radial velocities as well as the best representative rotation disk parameters. We overplotted the attained rotation of the SMC disk with a solid line and those considering the errors in the inclination of the disk, the position angle of the LON, the systemic and transversal velocities of the SMC center, and the disk velocity dispersion with dashed lines. The error bars of the plotted cluster motions account not only for the measured errors in proper motion and radial velocity, but also for those from the adopted best solution for the 3D movement of the SMC center, propagated through the transformation equations and added in quadrature. As can be seen, the cluster motions relative to the SMC center projected onto the sky resemble that of the rotation of a disk, with some noticeable scatter and some cluster placed beyond the mean rotational pattern. Zivick et al. (2021) point to the need to treat the SMC as a series of different populations with distinct kinematics, so that they can provide a better handle on constraining the LMC-SMC interaction, as opposed to measuring averaged systemic SMC properties over multiple stellar populations. We note that the cluster ages (1 < age (Gyr) < 10) do not seem to be responsible for the scatter seen in Fig. 4, which implies that the use of clusters in the considered age range, rather than individual stars, likely mitigates the concerns raised by Zivick et al. (2021). Instead, we found that the velocity dispersion plays an important role in dealing with such a scatter around the mean rotation curves. Particularly, the dashed curves correspond to velocity dispersions along the right ascension and declination axes and along the line-of-sight of 50, 20, and 25 km s−1, respectively. These results show that rotation alone is not sufficient to explain the observed kinematic behavior in the SMC, and, therefore, using a rotating disk model for the fitting of the SMC case is subject to uncertainty. For completeness purposes, we show in Fig. 5 the velocity vectors projected on the sky.
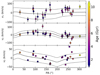 |
Fig. 4. Rotation velocity components versus position angle of 25 SMC star clusters. The solid and dashed lines correspond to the best solution and dispersion for the SMC disk rotation. |
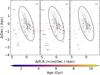 |
Fig. 5. Spatial distribution of SMC clusters compiled in Bica et al. (2020; gray dots) with the elliptical framework adopted by Piatti et al. (2007) for a semimajor axis of 3° superimposed. The colored age-based vectors represent the residual velocity vectors projected on the sky for the studied cluster sample, namely: the cluster velocity minus the model velocity at its position (left panel), the cluster velocity minus the mean SMC motion (middle panel), and those for the solid lines of Fig. 4 (right panel). The black arrow represents a velocity of 100 km s−1. |
We compared the resulting parameters with those from previous works based on different stellar field populations (red giant branch, RR Lyrae, Cepheids) and H I gas (see Tables 1, 2, and 4 of Zivick et al. 2021; Niederhofer et al. 2021; De Leo et al. 2020, respectively). We found that the center of the SMC cluster rotation disk coincides fairly well with the so-called optical center (right ascension = 13.1875, declination = −72.8286; Crowl et al. 2001) and is still near to those determined from SMC stellar components; the center of the SMC cluster rotation disk determined from H I gas analyses is clearly different. When the proper motions of the SMC center are considered, the present values are in very good agreement with the most recent estimates (Zivick et al. 2021; Niederhofer et al. 2021; Gaia Collaboration 2021), which is also the case for the SMC systemic velocity (De Leo et al. 2020). The derived mean distance of the SMC cluster population agrees with the bulk of previous estimates (Graczyk et al. 2020, and references therein), and the representative inclination and position angle of the LON are indistinguishable, within the errors, from those of the SMC rotation disk obtained by Zivick et al. (2021).
Such an overall similitude between the resulting SMC cluster rotation disk (for clusters with ages between 1 and 10 Gyr old) and that of the composite stellar field population suggests that both galaxy components are at some level kinematically synchronized. Our findings support the notion of a relatively slow rotation disk (rotation velocity of 25 km s−1) with respect to the rotation velocity of the LMC (∼70 km s−1; Piatti et al. 2019) and the Milky Way (∼240 km s−1; Piatti 2019). Zivick et al. (2021) find a rotation velocity of 20 ± 7 km s−1 for the innermost region with a radius of ∼2 kpc from the SMC. Here we confirmed that a similar rotation disk pattern is observed out to ∼4 kpc from the SMC center. In the plane of the sky, the SMC rotation disk can be roughly represented by a tilted edge-on rotation disk that is being stretched in a direction perpendicular to it, nearly parallel to the LMC-SMC connecting bridge. The stretching signature is witnessed by the dispersion velocity in right ascension as compared to that along the declination and radial velocity axes (Zivick et al. 2021; Gaia Collaboration 2021).
Acknowledgments
We thank the referee for the thorough reading of the manuscript and timely suggestions to improve it. This work has made use of data from the European Space Agency (ESA) mission Gaia (https://www.cosmos.esa.int/gaia), processed by the Gaia Data Processing and Analysis Consortium (DPAC, https://www.cosmos.esa.int/web/gaia/dpac/consortium). Funding for the DPAC has been provided by national institutions, in particular the institutions participating in the Gaia Multilateral Agreement.
References
- Bica, E., Westera, P., Kerber, L. d. O., et al. 2020, AJ, 159, 82 [Google Scholar]
- Crowl, H. H., Sarajedini, A., Piatti, A. E., et al. 2001, AJ, 122, 220 [NASA ADS] [CrossRef] [Google Scholar]
- Da Costa, G. S., & Hatzidimitriou, D. 1998, AJ, 115, 1934 [Google Scholar]
- De Leo, M., Carrera, R., Noël, N. E. D., et al. 2020, MNRAS, 495, 98 [CrossRef] [Google Scholar]
- Di Teodoro, E. M., McClure-Griffiths, N. M., Jameson, K. E., et al. 2019, MNRAS, 483, 392 [Google Scholar]
- Gaia Collaboration (Prusti, T., et al.) 2016, A&A, 595, A1 [NASA ADS] [CrossRef] [EDP Sciences] [Google Scholar]
- Gaia Collaboration (Luri, X., et al.) 2021, A&A, 649, A7 [EDP Sciences] [Google Scholar]
- Graczyk, D., Pietrzynski, G., Thompson, I. B., et al. 2020, ApJ, 904, 13 [Google Scholar]
- Kamann, S., Bastian, N., Husser, T. O., et al. 2018, MNRAS, 480, 1689 [Google Scholar]
- Niederhofer, F., Cioni, M.-R. L., Rubele, S., et al. 2018, A&A, 613, L8 [CrossRef] [EDP Sciences] [Google Scholar]
- Niederhofer, F., Cioni, M.-R. L., Rubele, S., et al. 2021, MNRAS, 502, 2859 [Google Scholar]
- Parisi, M. C., Grocholski, A. J., Geisler, D., Sarajedini, A., & Clariá, J. J. 2009, AJ, 138, 517 [Google Scholar]
- Parisi, M. C., Geisler, D., Clariá, J. J., et al. 2015, AJ, 149, 154 [Google Scholar]
- Piatti, A. E. 2017a, ApJ, 834, L14 [Google Scholar]
- Piatti, A. E. 2017b, MNRAS, 465, 2748 [Google Scholar]
- Piatti, A. E. 2017c, ApJ, 846, L10 [Google Scholar]
- Piatti, A. E. 2018, MNRAS, 477, 2164 [Google Scholar]
- Piatti, A. E. 2019, ApJ, 882, 98 [NASA ADS] [CrossRef] [Google Scholar]
- Piatti, A. E. 2021, A&A, 647, A11 [EDP Sciences] [Google Scholar]
- Piatti, A. E., & Bica, E. 2012, MNRAS, 425, 3085 [NASA ADS] [CrossRef] [Google Scholar]
- Piatti, A. E., Sarajedini, A., Geisler, D., Clark, D., & Seguel, J. 2007, MNRAS, 377, 300 [NASA ADS] [CrossRef] [Google Scholar]
- Piatti, A. E., Cole, A. A., & Emptage, B. 2018, MNRAS, 473, 105 [Google Scholar]
- Piatti, A. E., Alfaro, E. J., & Cantat-Gaudin, T. 2019, MNRAS, 484, L19 [Google Scholar]
- Pryor, C., & Meylan, G. 1993, in Structure and Dynamics of Globular Clusters, eds. S. G. Djorgovski, & G. Meylan, ASP Conf. Ser., 50, 357 [Google Scholar]
- Ripepi, V., Molinaro, R., Musella, I., et al. 2019, A&A, 625, A14 [NASA ADS] [CrossRef] [EDP Sciences] [Google Scholar]
- van der Marel, R. P., Alves, D. R., Hardy, E., & Suntzeff, N. B. 2002, AJ, 124, 2639 [NASA ADS] [CrossRef] [Google Scholar]
- Walker, M. G., Mateo, M., Olszewski, E. W., et al. 2006, AJ, 131, 2114 [Google Scholar]
- Zivick, P., Kallivayalil, N., van der Marel, R. P., et al. 2018, ApJ, 864, 55 [Google Scholar]
- Zivick, P., Kallivayalil, N., & van der Marel, R. P. 2021, ApJ, 910, 36 [Google Scholar]
All Tables
All Figures
|
Fig. 1. Selected Gaia EDR3 stars distributed in the field of NGC 339. The cluster circle and six adjacent star field circles of equal size are drawn. The size of the symbols is proportional to the star brightness (G mag). |
| In the text | |
|
Fig. 2. VPD (left panels) and cluster field (right panels) of NGC 339. The labels indicate the adjacent star field used to clean the cluster VPD. Magenta symbols represent the stars that remained un-subtracted after the cleaning procedure. |
| In the text | |
|
Fig. 3. VPD for selected Gaia EDR3 stars distributed in the field of NGC 339, colored according to the assigned membership probability. |
| In the text | |
|
Fig. 4. Rotation velocity components versus position angle of 25 SMC star clusters. The solid and dashed lines correspond to the best solution and dispersion for the SMC disk rotation. |
| In the text | |
|
Fig. 5. Spatial distribution of SMC clusters compiled in Bica et al. (2020; gray dots) with the elliptical framework adopted by Piatti et al. (2007) for a semimajor axis of 3° superimposed. The colored age-based vectors represent the residual velocity vectors projected on the sky for the studied cluster sample, namely: the cluster velocity minus the model velocity at its position (left panel), the cluster velocity minus the mean SMC motion (middle panel), and those for the solid lines of Fig. 4 (right panel). The black arrow represents a velocity of 100 km s−1. |
| In the text | |
Current usage metrics show cumulative count of Article Views (full-text article views including HTML views, PDF and ePub downloads, according to the available data) and Abstracts Views on Vision4Press platform.
Data correspond to usage on the plateform after 2015. The current usage metrics is available 48-96 hours after online publication and is updated daily on week days.
Initial download of the metrics may take a while.