Fig. 5.
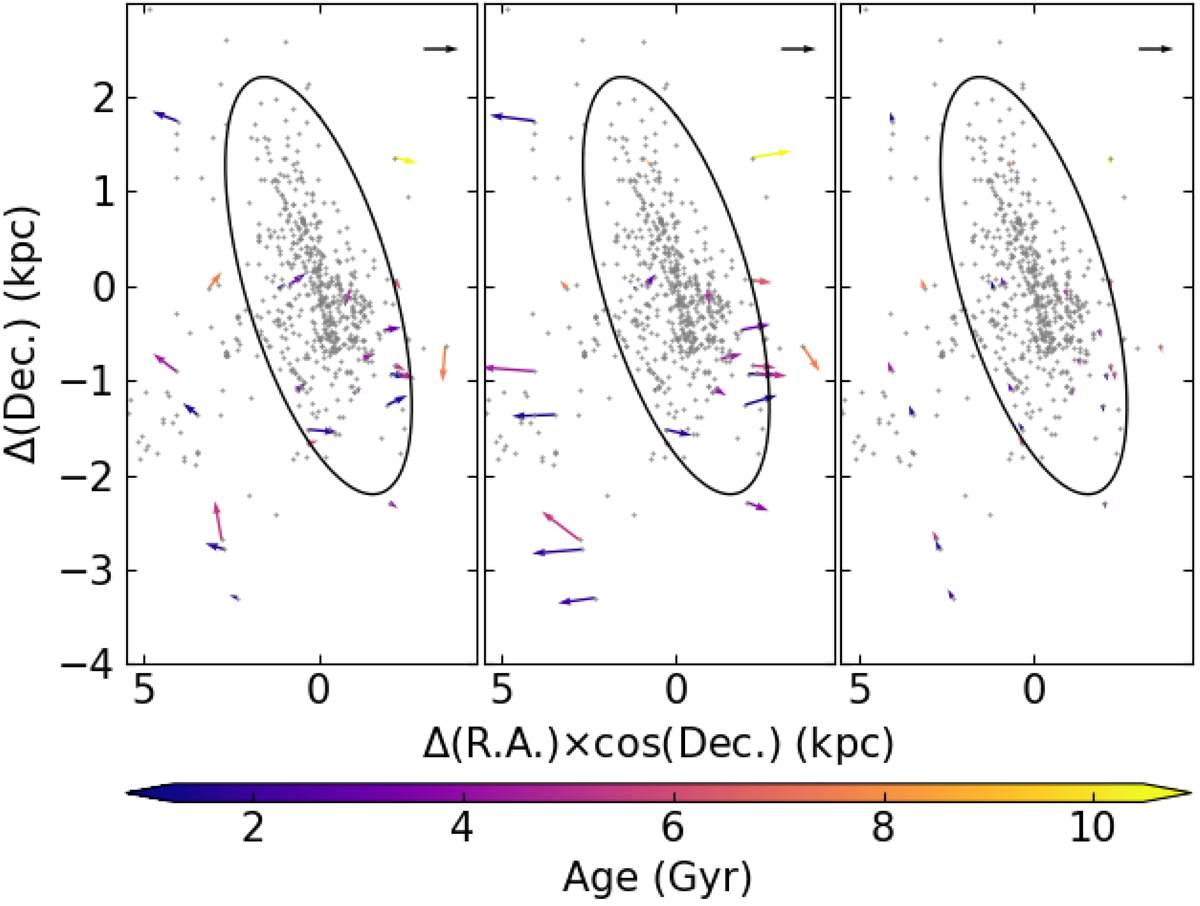
Spatial distribution of SMC clusters compiled in Bica et al. (2020; gray dots) with the elliptical framework adopted by Piatti et al. (2007) for a semimajor axis of 3° superimposed. The colored age-based vectors represent the residual velocity vectors projected on the sky for the studied cluster sample, namely: the cluster velocity minus the model velocity at its position (left panel), the cluster velocity minus the mean SMC motion (middle panel), and those for the solid lines of Fig. 4 (right panel). The black arrow represents a velocity of 100 km s−1.
Current usage metrics show cumulative count of Article Views (full-text article views including HTML views, PDF and ePub downloads, according to the available data) and Abstracts Views on Vision4Press platform.
Data correspond to usage on the plateform after 2015. The current usage metrics is available 48-96 hours after online publication and is updated daily on week days.
Initial download of the metrics may take a while.