| Issue |
A&A
Volume 650, June 2021
|
|
|---|---|---|
| Article Number | A172 | |
| Number of page(s) | 11 | |
| Section | Interstellar and circumstellar matter | |
| DOI | https://doi.org/10.1051/0004-6361/202140560 | |
| Published online | 24 June 2021 | |
ALMA observations of doubly deuterated water: inheritance of water from the prestellar environment
1
Niels Bohr Institute & Centre for Star and Planet Formation, University of Copenhagen,
Øster Voldgade 5-7,
1350
Copenhagen K, Denmark
e-mail: This email address is being protected from spambots. You need JavaScript enabled to view it.
2
Laboratoire d’Astrophysique de Bordeaux, Univ. Bordeaux, CNRS, B18N, allée Geoffroy Saint-Hilaire,
33615
Pessac, France
3
Institut de Recherche en Astrophysique et Planétologie, Université de Toulouse, UPS-OMP, CNRS, CNES,
9 Av. du Colonel Roche,
31028
Toulouse Cedex 4, France
4
Leiden Observatory, Leiden University,
PO Box 9513,
2300 RA
Leiden, The Netherlands
5
Max-Planck Institute für extraterrestrische Physik (MPE),
Giessenbachstrasse,
85748
Garching, Germany
6
National Astronomical Observatory of Japan,
Osawa 2-21-1,
Mitaka,
Tokyo
181-8588, Japan
7
Institute of Astronomy and Astrophysics,
Academia Sinica, No. 1, Sec. 4, Roosevelt Road,
Taipei
10617,
Taiwan,
ROC
8
Department of Space, Earth and Environment, Chalmers University of Technology, Onsala Space Observatory,
439 92
Onsala, Sweden
Received:
15
February
2021
Accepted:
9
April
2021
Abstract
Context. Establishing the origin of the water D/H ratio in the Solar System is central to our understanding of the chemical trail of water during the star and planet formation process. Recent modeling suggests that comparisons of the D2O/HDO and HDO/H2O ratios are a powerful way to trace the chemical evolution of water and, in particular, determine whether the D/H ratio is inherited from the molecular cloud or established locally.
Aims. We seek to determine the D2O column density and derive the D2O/HDO ratios in the warm region toward the low-mass Class 0 sources B335 and L483. The results are compared with astrochemical models and previous observations to determine their implications for the chemical evolution of water.
Methods. We present ALMA observations of the D2O 11,0–10,1 transition at 316.8 GHz toward B335 and L483 at ≲0.′′5 (≲100 au) resolution, probing the inner warm envelope gas. The column densities of D2O, HDO, and H218O are determined by synthetic spectrum modeling and direct Gaussian fitting, under the assumption of a single excitation temperature and similar spatial extent for the three water isotopologs.
Results. D2O is detected toward both sources in the inner warm envelope. The derived D2O/HDO ratio is (1.0 ± 0.2) × 10−2 for L483 and (1.4 ± 0.1) × 10−2 for B335. These values indicate that the D2O/HDO ratio is higher than the HDO/H2O ratios by a factor of ≳2 toward both sources.
Conclusions. The high D2O/HDO ratios are a strong indication of chemical inheritance of water from the prestellar phase down to the inner warm envelope. This implies that the local cloud conditions in the prestellar phase, such as temperatures and timescales, determine the water chemistry at later stages and could provide a source of chemical differentiation in young systems. In addition, the observed D2O/H2O ratios support an observed dichotomy in the deuterium fractionation of water toward isolated and clustered protostars, namely, a higher D/H ratio toward isolated sources.
Key words: astrochemistry / stars: formation / ISM: abundances / submillimeter: stars / ISM: individual objects: L483 / ISM: individual objects: B335 (except planetary nebulae)
© ESO 2021
1 Introduction
Addressing when and how water is synthesized during the formation of stars and planetary systems is essential to our understanding of the delivery of water, and other volatiles, to young planets. Water is a requirement for life as we know it and therefore central for the habitability of planets (e.g., Chyba & Hand 2005). Additionally, water acts as a coolant in molecular gas and is a major constituent of the solid mass reservoirs in protoplanetary disks (e.g., van Dishoeck et al. 2014; Karska et al. 2018).
Water is among the most abundant molecules in the interstellar medium and has been observed at all major stages of star and planet formation. In prestellar cores, water is a major constituent of the thick ice caps with Xice ~ 10−4 with respect to H2 (e.g., Whittet et al. 1996; Bergin & Snell 2002; Boogert et al. 2015). In the inner warm envelope toward Class 0 sources, water ice is thermally desorbed, and the derived gas-phase water abundance reaches Xgas ~ 10−7–10−4 (e.g., Ceccarelli et al. 2000; Persson et al. 2016). In outflows, water is sputtered off the grains or synthesized directly in the gas phase, and the abundances can reach Xgas ~ 10−6–10−4 (e.g., Kristensen et al. 2017). Meanwhile, a recent search for water toward nearby Class I sources shows that gas-phase water abundances are low in young disks (Xgas ≲ 10−6), indicating that most of the water remains locked in ice at this stage (Harsono et al. 2020). These observations provide vital constraints on the chemical evolution of water and reveal that water is formed as ice at high abundance in molecular clouds and prestellar cores (van Dishoeck et al. 2021). This is confirmed by models of the chemical evolution during star formation (e.g., Taquet et al. 2013b; Furuya et al. 2016; Coutens et al. 2020). However, a central question remains as to what extent is water in protoplanetary disk inherited from the prestellar cloud or synthesized locally in the disk (e.g., Visser et al. 2009; Cleeves et al. 2014). If prestellar inheritance is the dominant source of water in the protoplanetary disk, then the water chemistry is set by the conditions in the local cloud environment (e.g., the temperature, radiation field, and duration). This could promote some chemical differentiation in planetary systems. Conversely, if local processing in the disk is significant, then local conditions in the disk may strongly influence the chemistry of water and other volatiles.
By studying the deuterium fractionation of water, we can determine how the physical conditions affect the water chemistry and track the chemical evolution during star and planet formation (e.g., Ceccarelli et al. 2014). Deuterium fractionation occurs as a consequence of several chemical processes that depend sensitively on the temperature, density, visual extinction, and ionization sources (Caselli et al. 2012). At low temperatures (≲ 50 K), the prominent pathway is the gas-phase exchange reaction H + HD ⇌ H2D+ + H2 + ΔE, where ΔE depends on the spin state of the involved reactants. This forward reaction is endothermic, and the backward reaction is inhibited at low temperatures, thereby leading to an enrichment of H2D+ relative to H
 . H2D+ (and D2H+, D
 ) dissociatively recombines with free electrons to form atomic D, thus increasing the local atomic D/H ratio in the gas phase and ultimately on dust grain surfaces where water and other molecules are formed through hydrogenation (Tielens 1983; Roberts et al. 2003). Detections of gas phase H2D+ confirm that this enrichment is occurring in the gas phase in prestellar cores (Caselli et al. 2003; Vastel et al. 2004).
Observations of HDO and H O toward Class 0 source show that the degree of deuterium fractionation varies on different spatial scales (e.g., Persson et al. 2014). Single-dish observations, some of which may arise in the cold extended envelope, reveal high D/H ratios of water; HDO/H2O ratios range from 10−3 to 10−2 (Stark et al. 2004; Parise et al. 2005; Coutens et al. 2012). Meanwhile, interferometric observations targeting the inner warm region have found much lower water deuteration; in these observations HDO/H2O ratios range from 10−4 –10−3 (Jørgensen & van Dishoeck 2010; Taquet et al. 2013a; Persson et al. 2014; Jensen et al. 2019). The first detection of interstellar D2O was presented by Butner et al. (2007), who derived a D2O/HDO ratio of 1.7 × 10⁻³ toward IRAS16293-2422 based on single-dish observations. In a later work, Coutens et al. (2012) found a higher D2O/HDO ratio of ~0.06 toward the same source using Herschel HIFI data. Interferometric detections of D2O on inner envelope scales prior to this work are limited to Coutens et al. (2014), who found a high D2O/HDO ratio of ~1% and D2O/H2O ~ 2 × 10⁻⁵ toward NGC 1333 IRAS 2A. The current observational understanding is outlined in Fig. 1.
The observed difference in D/H ratios on different spatial scales can be understood as a result of the chronological evolution of water chemistry during star formation (Dartois et al. 2003; Taquet et al. 2013b; Furuya et al. 2016). Before cloud collapse, water ice is formed in the molecular cloud with a lower deuterium fraction, as a result of higher temperatures and moderate extinction in this phase (T ~ 20 K, Av ≲ 5 mag). Later, as the cloud core cools and contracts, the extinction increases and CO is depleted (e.g., Caselli et al. 1999). During this phase, the deuterium fractionation becomes highly efficient, and a second generation of highly deuterated water ice is formed. This chronology leads to two distinct components in the interstellar ice: the bulk ice mantle consists of a water-richice with lower D/H ratio, and the surface consists of a mix of highly deuterated water, CO, and complex organics (see Fig. 1). This scenario can explain the observed deuterium fractionations: on larger spatial scales, the bulk water reservoir remains in the solid phase, and the observed gas phase primarily consists of water with a high D/H ratio. This gas-phase water is either photo-desorbed from the ice surface layers or formed directly in the gas phase at low temperature and high extinction, that is, with a high D/H ratio (Taquet et al. 2013b; Furuya et al. 2016). Meanwhile, in the inner warm gas, where the ice is entirely sublimated, the gas-phase HDO/H2O ratio of water is lowered, since the ice reservoir with a lower D/H ratio is released from the dust grains. The similarity between D2O/HDO ratios on larger and smaller scales support this scenario; the abundance of deuterated water isotopologs is low in the bulk water ice, and consequently the ratio is largely unaffected by the sublimation of the bulk water ice.
A consequence of the above scenario for water formation is that the D/H ratio of water could depend on the physicalconditions in the molecular cloud and prestellar core prior to and during the protostellar collapse. Lower temperatures or a longer duration of the deeply embedded phase would increase the D/H ratio observed in the inner warm region. Conversely, a faster collapse or warmer gas temperature could lower the D/H ratio in the inner warm region. This would imply a relation between the bulk water D/H ratio and the dynamics of the formation environment. Isolated protostars may collapse more slowly than clustered counterparts because the stability of the cloud is determined solely by the internal cloud structure (Ward-Thompson et al. 2007; Enoch et al. 2008). Moreover, the temperature in clustered regions could be higher owing to, for instance, more external radiation or shock heating (Krumholz 2014; Hocuk et al. 2017). Either of these scenarios would enhance the D/H ratio toward isolated protostars in contrast to clustered protostars, in which external factors can influence the physicalconditions. Such a differentiation was recently suggested based on ALMA observations of HDO and H O in the warm inner envelope toward three isolated protostars (Jensen et al. 2019). If the enhanced HDO/H2O ratio is a consequence of environmental effects, then the same might also apply to D2O.
In this work, we present the first ALMA detections of D2O in the inner warm region toward the isolated low-mass Class 0 protostars B335 and L483. We combine the D2O detections with previous detections of HDO and H O toward the sources to derive D2O/HDO, D2O/H2O and HDO/H2O ratios consistently. This work aims to constrain the chemical evolution of water between the molecular cloud and the inner warm envelope toward Class 0 sources. Furthermore, accurate determination of the D/H ratio in the warm envelope allow for comparison between the deuterium fractionation in protoplanetary disk and warm envelopes toward Class 0 sources, thereby establishing a possible link between these regimes.
The paper is organized as follows. In Sect. 2, the observations and data reduction are presented. The data analysis is presented in Sect. 3, and the results are discussed in Sect. 4. Throughout the paper we refer to NGC 1333 IRAS 2A as IRAS 2A. We denote HDO/H2O as fD1 and D2O/HDO as fD2, and use both terms interchangeably. Furthermore, we refer to the inner warm gas component, where r ≲ 100 au and T ≳ 100 K, as the warm envelope.
 |
Fig. 1 Schematics of the predicted ice structure in the prestellar core stage (left) and the observed water deuterium fractionation toward embedded low-mass protostars (right). The outer layer of the ice mantle, which has high water D/H ratio, may stem from nonthermal desorption in the cold envelope or cold gas-phase formation. Meanwhile, the whole mantle is sublimated in the hot corino, lowering the HDO/H2O ratio. The schematical structure is proposed by Furuya et al. (2016). The figure is adopted from van Dishoeck et al. (2021). |
Observation log.
2 Observations
The low-mass protostars B335 and L483 were observed with ALMA during Cycle 7 (PI: Sigurd S. Jensen, projectid: 2019.1.00720.S). Information on the observation dates and calibration sources can be found in Table 1. In the present analysis, we also utilize additional spectral windows from the data presented in Jensen et al. (2019) toward both sources; this latter work gives a detailed description of those observations. The spectral setup targeted the D2O 11,0 –10,1 transition at316.8119 GHz in the ALMA band 7. The imaged spectral windows contain 1920 channels with a width of 122 kHz (0.11 km s−1). The observed phase centers are αJ2000 : 19:37:00.89, δJ2000 : +07:34:09.5 for B335, and αJ2000 : 18:17:29.91, δJ2000 : −04:39:39.6 for L483. The source velocities applied to the spectral tunings are listed in Table 1.
Each dataset was pipeline-calibrated using CASA 5.6 (McMullin et al. 2007). Subsequent phase self-calibration was attempted for each dataset with CASA 5.6. For B335, self-calibration was successful with an improved signal-to-noise ratio (S/N) of ~ 25%; however, forL483, no improvement in S/N level was achieved, and therefore the ALMA pipeline product was preferred.
Imaging was performed with the TCLEAN algorithm with a robust parameter of 0.5. Toward each source, a continuum image at 302 GHz was created and compared with previous ALMA observations toward the sources. The intensities and morphologies of the continuum images are consistent with previous interferometric observations of the sources (e.g., Imai et al. 2016, 2019; Oya et al. 2017; Jacobsen et al. 2019). The final continuum images are shown in Fig. 2. The synthesized beam size in spectral window centered on the D2O transition are 0.′′38 × 0.′′37 and 0.′′56 × 0.′′46 for B335 and L483, respectively.
Continuum subtraction for each spectral window was performed using the sigma-clipping method with the STATCONT code presented indetail in Sánchez-Monge et al. (2018). We preferred to use this method because both sources display rich hot corino emission, which made continuum subtraction through the UVCONTSUB routine in CASA challenging (see, e.g., Jørgensen et al. 2016). For the line analysis, we extracted the spectrum from a single pixel toward the continuum peak position for each source.
The emission lines presented in this work are identified using data from the Jet Propulsion Laboratory (JPL, Pickett et al. 1998) and the Cologne Database for Molecular Spectroscopy (CDMS, Müller et al. 2001). The spectroscopic data used to identify D2O, HDO, H O are from Brünken et al. (2007), Messer et al. (1984), and de Lucia et al. (1972), respectively. Furthermore, spectroscopic data for CH3OCH3, and CH3OD are from Endres et al. (2009) and Anderson et al. (1993), respectively. For CH3OD, the exact partition function is unknown, and the current analysis relies on a partition function scaled from the CH
 OH partition function, similar to Jørgensen et al. (2018). All querying was done through the Splatalogue interface1. Throughout this work, the H2O column density is estimated from H
 O by adopting a 16O/18O ratio of 560 (Wilson & Rood 1994).
 |
Fig. 2 Continuum emission at 301.7 GHz toward L483 and B335. The map shows emission above 1σrms with white contours at 5σrms, 10σrms, and 30σrms. Linear scales are indicated in the lower right corner, assuming a distance of 100 pc to B335 and 200 pc to L483 (see Jensen et al. 2019, and references therein). The gray arrows indicate the direction of outflows that may be perturbing the dust distribution. The synthesized beam size is shown in the lower left corner. |
3 Results
The D2O lines were detected toward both sources as part of a broad emission feature. The emission feature was identified as D2O blended with two CH3OD transitions and, potentially, one CH3OCH3 transition. This identification is consistent with the observed feature toward IRAS 2A (Coutens et al. 2014). As the line is heavily blended, estimation of the column density is challenging, and two complimentary methods were employed. The spatial extent of the D2O and CH3OD emission is confined to the inner envelope, as shown in Fig. 3.
3.1 Synthetic spectrum modeling
The first method for the estimation of the D2O column density relies on a synthetic spectrum of the sources. Combining the ALMA data from Jensen et al. (2019) with those presented in this work, spectral coverage extends to several spectral windows in ALMA bands 5, 6, and 7. For B335, two unblended transitions of CH3OD and four unblended transitions of CH3OCH3 were identified. For L483, three unblended transitions of CH3OD and three unblended transitions of CH3OCH3 were identified. This allowed for accurate modeling of the blended emission feature around the D2O line (i.e., the combined emission from D2O, CH3OD, and CH3OCH3). The best fit was determined by χ2 minimization of the data around emission lines. Blended lines and transitions with high optical thickness were manually excluded from the χ2 estimation. The synthetic spectrum was calculated following the methodology presented in Möller et al. (2017) with the addition of an optical depth correction from Goldsmith & Langer (1999). Toward B335, the observed spectrum was best reproduced by a synthetic model with N(D2O) = 3.5 × 1015 cm−2, N(CH3OD) = 2.5 × 1017 cm−2, and N(CH3OCH3) = 1.3 × 1017 cm−2. For the water isotopologs, the synthetic spectrum model yields HDO/H2O = (6.3 ± 1.5) × 10−3 and D2O/HDO = (1.4 ± 0.1) × 10−2 for B335.
For L483, the synthetic spectrum modeling yields column densities of N(D2O) = 1.1 × 1015 cm−2, N(CH3OD) = 1.7 × 1017 cm−2, and N(CH3OCH3) = 7.9 × 1016 cm−2. The D/H ratios toward this source are then HDO/H2O = (4.0 ± 0.5) × 10−3 and D2O/HDO = (1.0 ± 0.2) × 10−2. The synthetic spectra are presented in the left panels of Figs. 4 and 5. For L483, the best-fit spectral model shows some deviation from the observed profile, however, the D2O column density is robust: changing the parameters of the CH3OD and CH3OCH3 components has little impact on the D2O abundance. We note that for L483, many emission lines are double-peaked Gaussians (see, e.g., Oya et al. 2017; Jacobsen et al. 2019). The parameters for the best-fit synthetic spectrum are presented in Table 2, for B335 and L483. The full spectral models for both sources are shown in Appendix A.
3.2 Least-squares fitting
In the second, complimentary method, the line profiles were fitted using the least-squares method with the SCIPY routine CURVE_FIT. Toward B335, the fit was allowed to include up to four Gaussian line profiles, one for each potential transition in the blended emission feature. Bounds on the fits were estimated from the HDO data, and other non-blended emission lines in the dataset. The best fit does not include a fourth component, corresponding to either the CH3OCH3 line at 316.7904 GHz or the CH3OD transition at 316.7916 GHz (i.e., only three Gaussian profiles were included in the final fit). The exclusion of a fourth component has limited impact on the Gaussian profile for D2O. The resulting fit is shown the right panel of Fig. 4. The column density is estimated from the fitted line profile by assuming local thermodynamic equilibrium (LTE) (Mangum & Shirley 2015). We adopted an excitation temperature of 220 K, which is derived from the synthetic spectrum; this method results in a D2O column density of 4.0 × 1015 cm−2. The HDO transitions presented in Jensen et al. (2019) give a HDO column density of 1.9 × 1017 cm−2 at the sameexcitation temperature, when a beam filling factor is applied for a source size of 0.′′ 2. This method then results in a D2O/HDO ratio of (2.1 ± 0.6) × 10−2. Evidently, the D2O/HDO ratios toward B335 are somewhat higher when using the Gaussian fits, however both methods yield high D2O/HDO ratios ≳10−2. We note that the HDO column density is different from that presented in Jensen et al. (2019) because a higher excitation temperature of 220 K and a smaller source size are used in this work. Furthermore, the synthetic model includes an optical depth correction and identifies a slight blending of the H O line, increasing the HDO/H2O ratio. Because of this, we consider the column densities presented in this work as more accurate. However, this does not impact the results and discussions of the relative HDO/H2O abundances in Jensen et al. (2019), in which identical excitation temperatures were used for all sources. The differences in the reported HDO/H2O ratios in this work and in Jensen et al. (2019) illustrate the dependence on the methodology and assumptions, however, the observed dichotomy between isolated and clustered protostars reported in that paper is robust. To remove the observed dichotomy requires consistently adopting lower excitation temperatures for the isolated sources, independent of the luminosity of the respective sources.
In the case of L483, the emission lines are generally double-peaked Gaussian profiles (Jensen et al. 2019). These features are more challenging to fit when strongly blended and attempts to fit double-peaked Gaussians to all four potential emission lines did not produce good results. Instead, single Gaussians were fitted to each transition, which provided reasonable fits (as shown in the right panel of Fig. 5). The fitted Gaussian profiles result in N(D2O) = 1.7 × 1015 cm−2, which, combined with N(HDO) = 1.2 × 1017 cm−2, yield D2O/HDO = (1.4 ± 0.4) × 10−2. Again, this method returns a higher D2O/HDO than the synthetic spectrum model. For L483, an excitation temperature of 165 K was used, which was derived from the synthetic spectrum model. Overall, both methods agree, given the inherent flux density uncertainty of ALMA (~ 10%) and the uncertainties in the fitting(~10%).
Both methods assume that water emission from the warm envelope is in LTE. Previous studies of water isotopologs with interferometers have assessed the validity of this approach. Persson et al. (2014) compare the optically thin LTE approximation to radiative transfer models for two Class 0 sources and find agreement between the two methods. Coutens et al. (2014) compare non-LTE RADEX calculations and LTE calculations for the same HDO transitions presented in this work and found that the LTE approach is valid for these transitions. Generally, the LTE approach is suitable for water emission in the inner envelope, where the densities are similar or higher than the critical densities for the targeted transitions.
 |
Fig. 3 Moment 0 maps of the D2O and CH3OD emission,excluding channels where the emission is blended. Maps show emission above 3σ, where |
 |
Fig. 4 Overview of the two methods used to determine the column density of D2O toward B335. Left: Synthetic spectrum model for the emission feature toward B335 for an assumed source size of 0.′′ 2. The estimated optical depth τ for D2O is shown in the upper left corner. The synthetic spectrum includes components from D2O, CH3OD, and CH3OCH3. Right: Least-squares fit to the emission profile. The best fit includes three Gaussian components, one identified as D2O, one identified as CH3OD at 316.7651 GHz, and a third component that may be either CH3OD at 316.7916 GHz or CH3OCH3 at 316.7904 GHz, or a convolution of both. |
Overview of the column densities for D2O, HDO, and H O derived with the best-fit synthetic spectrum model (Nmodel) and with the fitted Gaussian profiles (Nfit).
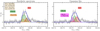 |
Fig. 5 Overview of the two methods used to determine the column density of D2O toward L483. Left: Synthetic spectrum model for the emission feature toward L483 for an assumed source size of 0.′′ 2. All molecules are fitted with double Gaussians. The estimated optical depth τ for both D2O profiles are shown in the upper left corner. The synthetic spectrum includes components from D2O, CH3OD, and CH3OCH3. Right: Least-squares fit to the emission profile. The best fit includes three components, one identified as D2O, one identified as CH3OD at 316.7651 GHz, and a third component that may be either CH3OD at 316.7916 GHz or CH3OCH3 at 316.7904 GHz, or a convolution of both. |
4 Discussion
The observed sources show high abundances of doubly deuterated water, D2O, with D2O/HDO ≳ 10−2 and D2O/HDO > HDO/H2O for both sources. The derived fD2/fD1 ratios for L483 and B335 are ~2.5 and ~ 2, respectively. This is similar to the previous determination of D2O/HDO in the warm envelope toward IRAS 2A presented in Coutens et al. (2014), who reported D2O/HDO ≳ 10−2 and fD2∕fD1 ≳ 7. Table 3 presents an overview of the HDO/H2O and D2O/HDO ratios toward low-mass Class 0 sources, limited to data which are determined with interferometric observations of the warm envelope. The high D2O abundances reported in this work has several implications for the inheritance of water and the tentative correlation between protostellar environment and D/H ratio in water, which is discussed below.
Overview of the D/H ratios of water in the warm region (≲100 au, T ≳ 100 K) toward Class 0 protostars.
4.1 Inheritance of water D/H ratio
The D/H ratio of water is an essential tool for determining the chemical evolution of water during star and planet formation. Deuterium fractionation of water can proceed through multiple pathways during the evolutionary stages of star and planet formation with varying efficiency (e.g., Caselli et al. 2012; van Dishoeck et al. 2014). In a recent work, Furuya et al. (2017) studied the evolution of the water D/H ratio during the star formation process from cloud to disk for hundreds of tracer particles in a 2D axisymmetric model, including both the protostellar collapse and the protoplanetary disk phases. These authors showed that water formation with HDO/H2O ratios in the range 10−4–10−3 can occur both through prestellar inheritance and in situ water formation in the cold midplane of the protoplanetary disk. Hence, distinguishing between inheritance and in situ formation based solely on the HDO/H2O ratio is challenging. Meanwhile, models suggest that the formation of D2O is inefficient inprotoplanetary disks when compared to the prestellar core phase. Therefore, Furuya et al. (2017) suggest that the ratio of fD2 /fD1 is a more robust tracer of chemical inheritance for water. Quantitatively, the model of Furuya et al. (2017) shows that a fD2 /fD1 ratio around~10 is formed in the prestellar phase, while a much lower ratio of fD2 /fD1 ~ 0.1 is found for water formed within the protoplanetary disk.
For L483 and B335, the observed fD2 /fD1 ratios are ≳ 2. Prior to this work, fD2 /fD1 was determined in the hot corino toward IRAS 2A, where the ratio is ≳7. The observed ratios, fD2/fD1 > 1, suggest that water in the warm envelope is predominantly inherited from the prestellar phase and has not undergone reprocessing during accretion from the cloud to the warm envelope toward these sources.
Recently, Jensen et al. (2021) studied the D/H ratio of water during the formation of several low-mass protostars in a dynamic 3D magnetohydrodynamics simulation of a molecular cloud region. For each protostar, thousands of tracer particles recorded the physical evolution during the accretion process from the large-scale environment down to the warm envelope. The temperature structure of the envelopes was calculated using the Monte Carlo radiative transfer code RADMC-3D (Dullemond et al. 2012). Subsequently, the chemical evolution along each particle trajectory was modeled to determine the gas-phase fD2 and fD1 ratios in the warm envelope. These authors find that fD2/fD1 depends on the choice of initial conditions in the prestellar cloud (e.g., the duration and temperature of this phase). A similar conclusion is presented in Taquet et al. (2013b), in which the authors study the formation of deuterated water for a broad range of initial conditions in the prestellar phase. These results suggest that the lower fD2/fD1 ratios may stem from different prestellar conditions, which was not included in the study by Furuya et al. (2017). By studying a range of initial conditions, Jensen et al. (2021) show that the D/H ratio of water in the warm envelope is determined by the conditions in the prestellar phase and is not sensitive to variations during the protostellar collapse itself, in other words, suggestive of chemical inheritance of water from the prestellar stages. A high degree of inheritance for water is also suggested by Cleeves et al. (2014), who show that the D/H ratio of water synthesized in situ in protoplanetary disks is low, and find that a high degree of inheritance is necessary to explain the D/H ratios of comets in the Solar System with low ionization rates.
With the high observed D2O/HDO ratios in the warm envelope, the case for a high degree of inheritance from the prestellar core stage down to the warm envelope (≲ 100 au) appears strong. The physical and chemical link between the warm envelope and the formation of protoplanetary disks and planets is unclear (e.g., Harsono et al. 2020). Recently, the evidence for early planet formation is growing with a number of detections of planetary signatures in young systems (e.g., Keppler et al. 2018; Teague et al. 2018; Harsono et al. 2018; Pinte et al. 2020; Alves et al. 2020). Furthermore, advances in planet formation theory suggest that planet formation may be a fast process and can occur early (e.g., Johansen & Lambrechts 2017). If planet formation starts early, the chemical inheritance observed in these Class 0 sources may directly impact the chemistry at the onset of planet formation. Currently, the D/H ratio of water in bona fide protoplanetary disks is unknown. An alternative tracer for the chemistry during planet formation is the study of the chemical composition of comets, including the D/H ratio (e.g., Mumma & Charnley 2011; Bockelée-Morvan et al. 2015). Comets are planetesimals in the outer solar nebula that record the pristine ice compositionin the Solar System during planet formation. Tentative evidence for a chemical link between the warm envelope and protoplanetary disks is emerging. Altwegg et al. (2017) determine the D/H ratios of water in the coma of comet 67P/Churyumov-Gerasimenko (hereafter comet 67P) with the ROSINA instrument. They found D2O/HDO = (1.8 ± 0.9) × 10−2 and HDO/H2O = (1.05 ± 0.14) × 10−3, corresponding to fD2 /fD1 ~ 17, which is incompatible with in situ D2O formation inthe protoplanetary disk (Furuya et al. 2017). This suggests a high degree of inheritance, and furthermore the measured D2O/HDO ratio is similar to the ratios observed in warm envelopes. Overall, current estimates of the D/H ratios of water in comets and warm envelopes could indicate a similar chemical evolution for the cold icy component that constitute comets such as comet 67P, and the material that enters the warm envelope, where ice is sublimated off the dust grains. A chemical link between the warm envelope and cometary bodies is also supported by the apparent correlation between complex organic molecules (COMs) in the hot corino of IRAS 16293-2422 and comet 67P, which may indicate a link between the chemical inventory in cold icy planetesimals and hot corinos (Drozdovskaya et al. 2019). Similarly, a recent study by Bianchi et al. (2019) also finds a correlation between the abundances of COMs in protostars and comets. The authors compared the inventory of COMs for a larger sample of Class 0 and Class I sources to cometary values in the literature and find good agreement between the abundances of COMs in Class 0 sources and comets, while the Class I sources showed more variation.
4.2 Environmental impact on the D/H ratio
The D2O/HDO ratios toward B335 and L483 are on the order of 10−2, similar to the lower limit derived in Coutens et al. (2014) toward IRAS 2A. Following the definitions of Jensen et al. (2019), B335 and L483 are isolated protostars (i.e., not associated with any cloud complexes) while IRAS 2A is located in NGC 1333. Given the higher HDO/H2O ratios in the isolated sources, these results appear to follow the same trend between water deuterium fractionation and protostellar environment. The isolated protostars show higher D/H ratios in HDO and similar D2O/HDO ratios, that is, the overall D/H ratio is higher than in clustered counterparts. Another way to illustrate this is to look at the D2O/H2O ratio. For L483, B335, and IRAS 2A, the D2O/H2O is 9 × 10⁻⁵, 4 × 10⁻⁵, and 2 × 10⁻⁵, respectively. Hence, the D2O/H2O ratios toward the isolated protostars are a factor ≳2 higher than the clustered source observed so far. The D2O abundances therefore corroborate a higher D/H ratio of water toward isolated protostars, similar to the trend observed in HDO. However, the sample size remains too small to draw definite conclusions and should be further expanded.
Jensen et al. (2019) propose that the observed trend in D/H ratios could originate from either higher temperatures or stronger irradiation in star-forming clusters, or a difference in the collapse timescale between isolated cores, which is subject to limited external perturbations, and clustered sources for which several mechanisms may perturb the dynamics of the cores, such as jets and outflows from nearby stars. Clustered star-forming regions may also be intrinsically more turbulent; that is, the probability of multiple star formation events may correlate with the turbulence in the region (e.g., Ward-Thompson et al. 2007; Krumholz 2014).
The physicochemical 3D models of water deuteration presented in Jensen et al. (2021) find that variations in the temperature or duration of the prestellar phase can induce the observed dichotomy in water D/H ratios. Higher temperatures during both the prestellar core phase and protostellar collapse lead to lower D/H ratios of water. Similarly, a shorter embedded phase (i.e., a shorter prestellar core duration) leads to a lower D/H ratio, which is consistent with the hypothesis that clustered sources collapse on shorter timescales. Both effects can drive the differences in D/H ratios between clustered and isolated low-mass protostars. Meanwhile, variations in irradiation appear unlikely to directly drive the dichotomy in observed D/H water ratios in the warm envelope toward low-mass protostars. The study by Jensen et al. (2021) demonstrates a link between the chemistry in the prestellar stages and gas-phase water D/H ratio in the warm envelope, which is corroborated by the observed D/H ratios of water from this region toward Class 0 sources. This link motivates further study, both observationally and theoretically, to determine whether other molecules exhibit a similar link between conditions in the environment and the chemistry in the warm envelope region toward young embedded protostars.
5 Summary and outlook
This work presents the first ALMA observations of D2O in the warm envelope toward low-mass protostars. We determine HDO/H2O and D2O/HDO ratios by combining the column densities of D2O with HDO and H O data. These ratios provide new insights into the chemical evolution of water during the star formation process.
-
Both L483 and B335 have D2O/HDO ratios ≳10−2. When combined with previous ALMA estimates of the HDO/H2O ratios, the [D2O/HDO]/[HDO/H2O] ratios are derived to be ~2.5 and ~2, respectively. D/H ratios of this magnitude are strong evidence of chemical inheritance from the prestellar core stage. Chemical models suggest that a D2O/HDO ratio of this magnitude can only form during the cold phase prior to star formation.
-
Both sources are isolated and show enhanced D2O/H2O ratios compared to a clustered counterpart by a factor of ≳2. The high D2O/H2O ratios strengthen the evidence for a correlation between the D/H ratio of water and the protostellar environment, as suggested in Jensen et al. (2019). This is consistent with a high degree of inheritance from the prestellar phases and provides a mechanism for chemical diversity in the envelopes surrounding embedded protostars (e.g., through a longer duration or colder temperatures in the prestellar phase).
-
The observed D2O/HDO ratios in hot corinos are similar to the value measured in Comet 67P of ~10−2, providing tentative evidence of a common chemical evolution of the water that sublimates in the warm envelope and water incorporated in comets and icy planetesimals that are the building blocks of planets in the Solar System.
These observations highlight the power of the deuterium fractionation as a tracer for the chemical trail during star formation. More observations of the D/H ratios of water at different stages of star and planet formation will provide further constraints on the amount of inheritance between the evolutionary stages and establish the impact of the local environment on the chemical evolution. The relation between the local cloud environment and isotope fractionation should be explored further by studying, for example, nitrogen or carbon fractionation, toward both isolated and clustered sources at various evolutionary stages.
Acknowledgements
The authors thank the referee for useful comments that helped improve the manuscript. This paper makes use of the following ALMA data: ADS/JAO.ALMA#2017.1.00693.S, ADS/JAO.ALMA#2019.1.00720.S. ALMA is a partnership of ESO (representing its member states), NSF (USA) and NINS (Japan), together with NRC (Canada), NSC and ASIAA (Taiwan), and KASI (Republic of Korea), in cooperation with the Republic of Chile. The Joint ALMA Observatory is operated by ESO, AUI/NRAO and NAOJ. The group of JKJ acknowledges support from the European Research Council (ERC) under the European Union’s Horizon 2020 research and innovation programme (grant agreement no. 646908) through ERC Consolidator Grant “S4F”. A.C. acknowledges financial support from the Agence Nationale de la Recherche (grant ANR-19-ERC7-0001-01). This paper makes use of MATPLOTLIB (Hunter 2007) and SCIPY (Virtanen et al. 2020).
Appendix A Full synthetic models
The complete synthetic spectrum models for H O, HDO, D2O, CH3OD, CH3OCH3 are shown in the Figs. A.1 and A.2.
 |
Fig. A.1 Overview of the complete synthetic spectrum model for emission lines toward B335 for an assumed source size of 0.′′ 2. The full model includes H |

 |
Fig. A.2 Overview of the complete synthetic spectrum model for emission lines toward L483 for an assumed source size of 0.′′ 2. The full model includes H |

References
- Altwegg, K., Balsiger, H., Berthelier, J. J., et al. 2017, Phil. Trans. Roy. Soc. London Ser. A, 375, 20160253 [Google Scholar]
- Alves, F. O., Cleeves, L. I., Girart, J. M., et al. 2020, ApJ, 904, L6 [CrossRef] [Google Scholar]
- Anderson, T., Herbst, E., & Delucia, F. C. 1993, J. Mol. Spectr., 159, 410 [NASA ADS] [CrossRef] [Google Scholar]
- Bergin, E. A., & Snell, R. L. 2002, ApJ, 581, L105 [NASA ADS] [CrossRef] [Google Scholar]
- Bianchi, E., Codella, C., Ceccarelli, C., et al. 2019, MNRAS, 483, 1850 [Google Scholar]
- Bockelée-Morvan, D., Calmonte, U., Charnley, S., et al. 2015, Space Sci. Rev., 197, 47 [Google Scholar]
- Boogert, A. C. A., Gerakines, P. A., & Whittet, D. C. B. 2015, ARA&A, 53, 541 [Google Scholar]
- Brünken, S., Müller, H. S. P., Endres, C., et al. 2007, Phys. Chem. Chem. Phys., 9, 2103 [CrossRef] [Google Scholar]
- Butner, H. M., Charnley, S. B., Ceccarelli, C., et al. 2007, ApJ, 659, L137 [NASA ADS] [CrossRef] [Google Scholar]
- Caselli, P., Walmsley, C. M., Tafalla, M., Dore, L., & Myers, P. C. 1999, ApJ, 523, L165 [Google Scholar]
- Caselli, P., van der Tak, F. F. S., Ceccarelli, C., & Bacmann, A. 2003, A&A, 403, L37 [NASA ADS] [CrossRef] [EDP Sciences] [Google Scholar]
- Caselli, P., Keto, E., Bergin, E. A., et al. 2012, ApJ, 759, L37 [Google Scholar]
- Ceccarelli, C., Castets, A., Caux, E., et al. 2000, A&A, 355, 1129 [NASA ADS] [Google Scholar]
- Ceccarelli, C., Caselli, P., Bockelée-Morvan, D., et al. 2014, in Protostars and Planets VI, eds. H. Beuther, R. S. Klessen, C. P. Dullemond, & T. Henning, 859 [Google Scholar]
- Chyba, C. F., & Hand, K. P. 2005, ARA&A, 43, 31 [Google Scholar]
- Cleeves, L. I., Bergin, E. A., Alexander, C. M. O. D., et al. 2014, Science, 345, 1590 [Google Scholar]
- Coutens, A., Vastel, C., Caux, E., et al. 2012, A&A, 539, A132 [NASA ADS] [CrossRef] [EDP Sciences] [Google Scholar]
- Coutens, A., Jørgensen, J. K., Persson, M. V., et al. 2014, ApJ, 792, L5 [NASA ADS] [CrossRef] [Google Scholar]
- Coutens, A., Commerçon, B., & Wakelam, V. 2020, A&A, 643, A108 [EDP Sciences] [Google Scholar]
- Dartois, E., Thi, W. F., Geballe, T. R., et al. 2003, A&A, 399, 1009 [NASA ADS] [CrossRef] [EDP Sciences] [Google Scholar]
- de Lucia, F. C., Helminger, P., Cook, R. L., & Gordy, W. 1972, Phys. Rev. A, 6, 1324 [NASA ADS] [CrossRef] [Google Scholar]
- Drozdovskaya, M. N., van Dishoeck, E. F., Rubin, M., Jørgensen, J. K., & Altwegg, K. 2019, MNRAS, 490, 50 [NASA ADS] [CrossRef] [Google Scholar]
- Dullemond, C. P., Juhasz, A., Pohl, A., et al. 2012, RADMC-3D: a multi-purpose radiative transfer tool [Google Scholar]
- Endres, C. P., Drouin, B. J., Pearson, J. C., et al. 2009, A&A, 504, 635 [NASA ADS] [CrossRef] [EDP Sciences] [Google Scholar]
- Enoch, M. L., Evans, Neal J., I., Sargent, A. I., et al. 2008, ApJ, 684, 1240 [NASA ADS] [CrossRef] [Google Scholar]
- Furuya, K., van Dishoeck, E. F., & Aikawa, Y. 2016, A&A, 586, A127 [NASA ADS] [CrossRef] [EDP Sciences] [Google Scholar]
- Furuya, K., Drozdovskaya, M. N., Visser, R., et al. 2017, A&A, 599, A40 [NASA ADS] [CrossRef] [EDP Sciences] [Google Scholar]
- Goldsmith, P. F., & Langer, W. D. 1999, ApJ, 517, 209 [Google Scholar]
- Harsono, D., Bjerkeli, P., van der Wiel, M. H. D., et al. 2018, Nat. Astron., 2, 646 [NASA ADS] [CrossRef] [Google Scholar]
- Harsono, D., Persson, M. V., Ramos, A., et al. 2020, A&A, 636, A26 [CrossRef] [EDP Sciences] [Google Scholar]
- Hocuk, S., Szűcs, L., Caselli, P., et al. 2017, A&A, 604, A58 [NASA ADS] [CrossRef] [EDP Sciences] [Google Scholar]
- Hunter, J. D. 2007, Comput. Sci. Eng., 9, 90 [NASA ADS] [CrossRef] [Google Scholar]
- Imai, M., Sakai, N., Oya, Y., et al. 2016, ApJ, 830, L37 [NASA ADS] [CrossRef] [Google Scholar]
- Imai, M., Oya, Y., Sakai, N., et al. 2019, ApJ, 873, L21 [NASA ADS] [CrossRef] [Google Scholar]
- Jacobsen, S. K., Jørgensen, J. K., Di Francesco, J., et al. 2019, A&A, 629, A29 [NASA ADS] [CrossRef] [EDP Sciences] [Google Scholar]
- Johansen, A., & Lambrechts, M. 2017, Ann. Rev. Earth Planet. Sci., 45, 359 [NASA ADS] [CrossRef] [Google Scholar]
- Jensen, S. S., Jørgensen, J. K., Kristensen, L. E., et al. 2019, A&A, 631, A25 [Google Scholar]
- Jensen, S. S., Jørgensen, J. K., Furuya, K., Haugbølle, T., & Aikawa, Y. 2021, A&A, 649, A66 [CrossRef] [EDP Sciences] [Google Scholar]
- Jørgensen, J. K., & van Dishoeck, E. F. 2010, ApJ, 725, L172 [NASA ADS] [CrossRef] [Google Scholar]
- Jørgensen, J. K., van der Wiel, M. H. D., Coutens, A., et al. 2016, A&A, 595, A117 [NASA ADS] [CrossRef] [EDP Sciences] [Google Scholar]
- Jørgensen, J. K., Müller, H. S. P., Calcutt, H., et al. 2018, A&A, 620, A170 [NASA ADS] [CrossRef] [EDP Sciences] [Google Scholar]
- Karska, A., Kaufman, M. J., Kristensen, L. E., et al. 2018, ApJS, 235, 30 [Google Scholar]
- Keppler, M., Benisty, M., Müller, A., et al. 2018, A&A, 617, A44 [NASA ADS] [CrossRef] [EDP Sciences] [Google Scholar]
- Kristensen, L. E., van Dishoeck, E. F., Mottram, J. C., et al. 2017, A&A, 605, A93 [NASA ADS] [CrossRef] [EDP Sciences] [Google Scholar]
- Krumholz, M. R. 2014, Phys. Rep., 539, 49 [NASA ADS] [CrossRef] [Google Scholar]
- Mangum, J. G., & Shirley, Y. L. 2015, PASP, 127, 266 [Google Scholar]
- McMullin, J. P., Waters, B., Schiebel, D., Young, W., & Golap, K. 2007, in Astronomical Data Analysis Software and Systems XVI, eds. R. A. Shaw, F. Hill, & D. J. Bell, Astronomical Society of the Pacific Conference Series 376, 127 [Google Scholar]
- Messer, J., Lucia, F. C. D., & Helminger, P. 1984, J. Mol. Spectr., 105, 139 [NASA ADS] [CrossRef] [Google Scholar]
- Möller, T., Endres, C., & Schilke, P. 2017, A&A, 598, A7 [NASA ADS] [CrossRef] [EDP Sciences] [Google Scholar]
- Müller, H. S. P., Thorwirth, S., Roth, D. A., & Winnewisser, G. 2001, A&A, 370, L49 [NASA ADS] [CrossRef] [EDP Sciences] [Google Scholar]
- Mumma, M. J., & Charnley, S. B. 2011, ARA&A, 49, 471 [NASA ADS] [CrossRef] [Google Scholar]
- Oya, Y., Sakai, N., Watanabe, Y., et al. 2017, ApJ, 837, 174 [NASA ADS] [CrossRef] [Google Scholar]
- Parise, B., Caux, E., Castets, A., et al. 2005, A&A, 431, 547 [NASA ADS] [CrossRef] [EDP Sciences] [Google Scholar]
- Persson, M. V., Jørgensen, J. K., van Dishoeck, E. F., & Harsono, D. 2014, A&A, 563, A74 [NASA ADS] [CrossRef] [EDP Sciences] [Google Scholar]
- Persson, M. V., Harsono, D., Tobin, J. J., et al. 2016, A&A, 590, A33 [NASA ADS] [CrossRef] [EDP Sciences] [Google Scholar]
- Pickett, H. M., Poynter, R. L., Cohen, E. A., et al. 1998, J. Quant. Spectr. Rad. Transf., 60, 883 [Google Scholar]
- Pinte, C., Price, D. J., Ménard, F., et al. 2020, ApJ, 890, L9 [NASA ADS] [CrossRef] [Google Scholar]
- Roberts, H., Herbst, E., & Millar, T. J. 2003, ApJ, 591, L41 [Google Scholar]
- Sánchez-Monge, Á., Schilke, P., Ginsburg, A., Cesaroni, R., & Schmiedeke, A. 2018, A&A, 609, A101 [NASA ADS] [CrossRef] [EDP Sciences] [Google Scholar]
- Stark, R., Sandell, G., Beck, S. C., et al. 2004, ApJ, 608, 341 [NASA ADS] [CrossRef] [Google Scholar]
- Taquet, V., López-Sepulcre, A., Ceccarelli, C., et al. 2013a, ApJ, 768, L29 [Google Scholar]
- Taquet, V., Peters, P. S., Kahane, C., et al. 2013b, A&A, 550, A127 [NASA ADS] [CrossRef] [EDP Sciences] [Google Scholar]
- Teague, R., Bae, J., Bergin, E. A., Birnstiel, T., & Foreman-Mackey, D. 2018, ApJ, 860, L12 [NASA ADS] [CrossRef] [Google Scholar]
- Tielens, A. G. G. M. 1983, A&A, 119, 177 [NASA ADS] [Google Scholar]
- van Dishoeck, E. F., Bergin, E. A., Lis, D. C., & Lunine, J. I. 2014, in Protostars and Planets VI, eds. H. Beuther, R. S. Klessen, C. P. Dullemond, & T. Henning, 835 [Google Scholar]
- van Dishoeck, E. F., Kristensen, L. E., Mottram, J. C., et al. 2021, A&A, 648, A24 [CrossRef] [EDP Sciences] [Google Scholar]
- Vastel, C., Phillips, T. G., & Yoshida, H. 2004, ApJ, 606, L127 [NASA ADS] [CrossRef] [Google Scholar]
- Virtanen, P., Gommers, R., Oliphant, T. E., et al. 2020, Nat. Methods, 17, 261 [Google Scholar]
- Visser, R., van Dishoeck, E. F., Doty, S. D., & Dullemond, C. P. 2009, A&A, 495, 881 [NASA ADS] [CrossRef] [EDP Sciences] [Google Scholar]
- Ward-Thompson, D., André, P., Crutcher, R., et al. 2007, in Protostars and Planets V, eds. B. Reipurth, D. Jewitt, & K. Keil, 33 [Google Scholar]
- Whittet, D. C. B., Schutte, W. A., Tielens, A. G. G. M., et al. 1996, A&A, 315, L357 [Google Scholar]
- Wilson, T. L.,& Rood, R. 1994, ARA&A, 32, 191 [Google Scholar]
All Tables
Overview of the column densities for D2O, HDO, and HO derived with the best-fit synthetic spectrum model (Nmodel) and with the fitted Gaussian profiles (Nfit).
Overview of the D/H ratios of water in the warm region (≲100 au, T ≳ 100 K) toward Class 0 protostars.
All Figures
|
Fig. 1 Schematics of the predicted ice structure in the prestellar core stage (left) and the observed water deuterium fractionation toward embedded low-mass protostars (right). The outer layer of the ice mantle, which has high water D/H ratio, may stem from nonthermal desorption in the cold envelope or cold gas-phase formation. Meanwhile, the whole mantle is sublimated in the hot corino, lowering the HDO/H2O ratio. The schematical structure is proposed by Furuya et al. (2016). The figure is adopted from van Dishoeck et al. (2021). |
| In the text | |
|
Fig. 2 Continuum emission at 301.7 GHz toward L483 and B335. The map shows emission above 1σrms with white contours at 5σrms, 10σrms, and 30σrms. Linear scales are indicated in the lower right corner, assuming a distance of 100 pc to B335 and 200 pc to L483 (see Jensen et al. 2019, and references therein). The gray arrows indicate the direction of outflows that may be perturbing the dust distribution. The synthesized beam size is shown in the lower left corner. |
| In the text | |
|
Fig. 3 Moment 0 maps of the D2O and CH3OD emission,excluding channels where the emission is blended. Maps show emission above 3σ, where |
| In the text | |
|
Fig. 4 Overview of the two methods used to determine the column density of D2O toward B335. Left: Synthetic spectrum model for the emission feature toward B335 for an assumed source size of 0.′′ 2. The estimated optical depth τ for D2O is shown in the upper left corner. The synthetic spectrum includes components from D2O, CH3OD, and CH3OCH3. Right: Least-squares fit to the emission profile. The best fit includes three Gaussian components, one identified as D2O, one identified as CH3OD at 316.7651 GHz, and a third component that may be either CH3OD at 316.7916 GHz or CH3OCH3 at 316.7904 GHz, or a convolution of both. |
| In the text | |
|
Fig. 5 Overview of the two methods used to determine the column density of D2O toward L483. Left: Synthetic spectrum model for the emission feature toward L483 for an assumed source size of 0.′′ 2. All molecules are fitted with double Gaussians. The estimated optical depth τ for both D2O profiles are shown in the upper left corner. The synthetic spectrum includes components from D2O, CH3OD, and CH3OCH3. Right: Least-squares fit to the emission profile. The best fit includes three components, one identified as D2O, one identified as CH3OD at 316.7651 GHz, and a third component that may be either CH3OD at 316.7916 GHz or CH3OCH3 at 316.7904 GHz, or a convolution of both. |
| In the text | |
|
Fig. A.1 Overview of the complete synthetic spectrum model for emission lines toward B335 for an assumed source size of 0.′′ 2. The full model includes H |
| In the text | |
|
Fig. A.2 Overview of the complete synthetic spectrum model for emission lines toward L483 for an assumed source size of 0.′′ 2. The full model includes H |
| In the text | |
Current usage metrics show cumulative count of Article Views (full-text article views including HTML views, PDF and ePub downloads, according to the available data) and Abstracts Views on Vision4Press platform.
Data correspond to usage on the plateform after 2015. The current usage metrics is available 48-96 hours after online publication and is updated daily on week days.
Initial download of the metrics may take a while.