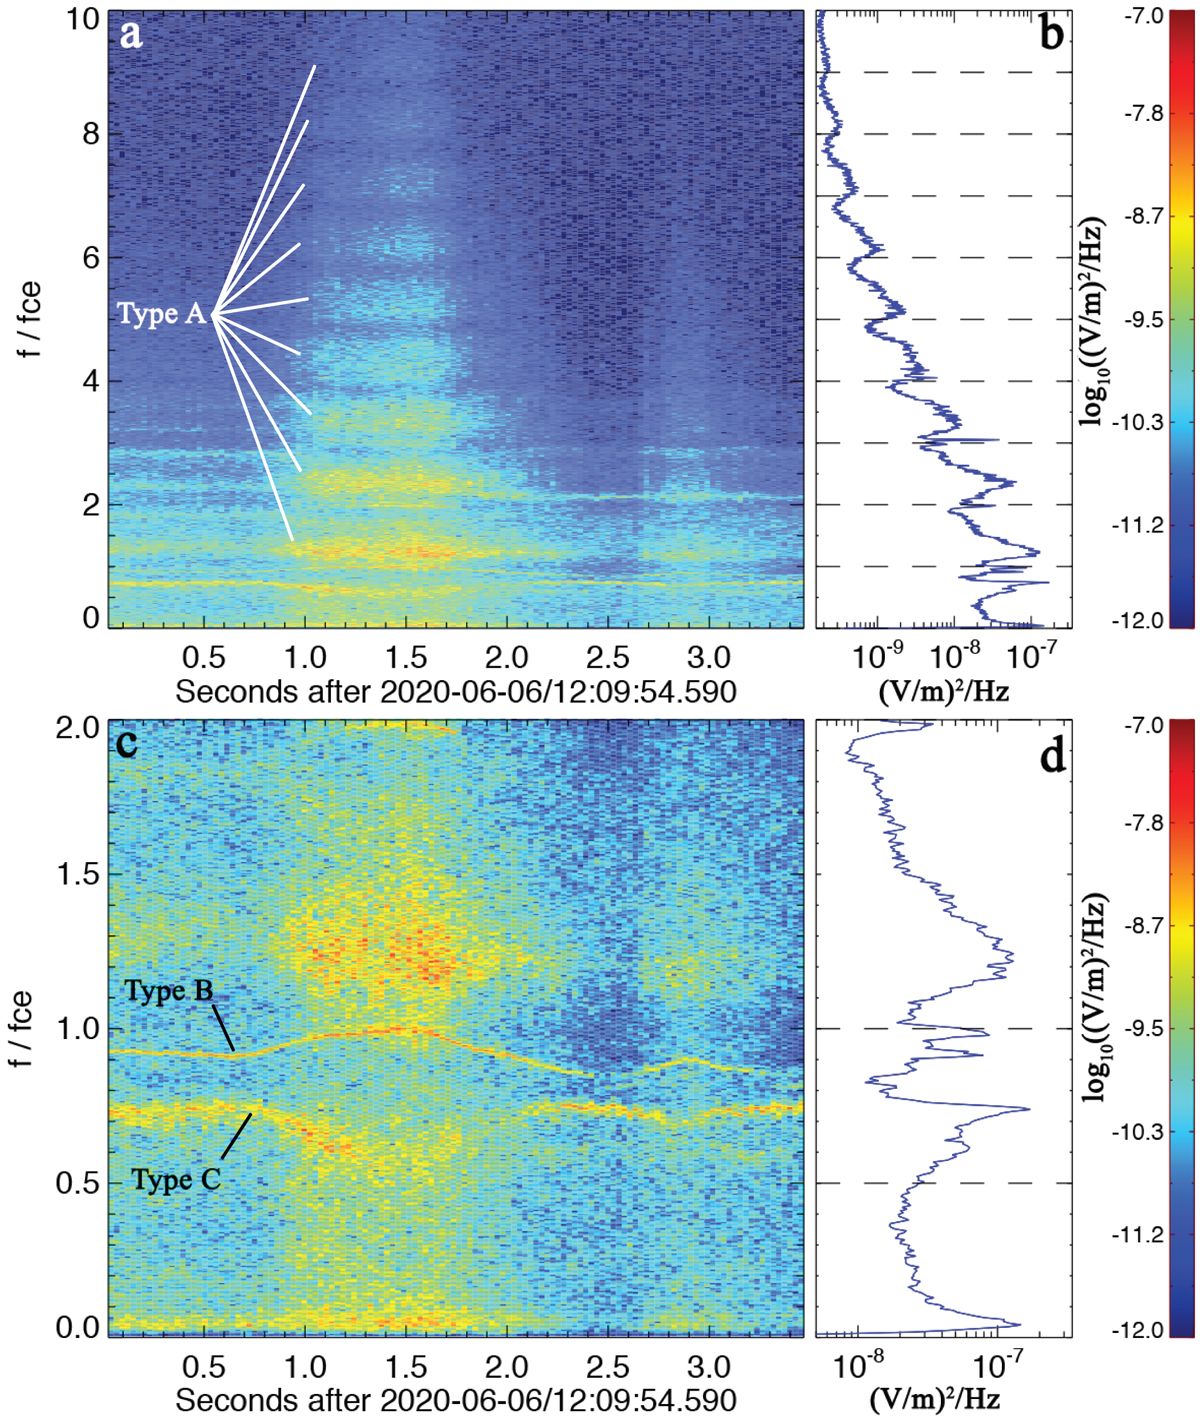
Fig. 2.

Spectrograms of the high-cadence electric field data from Fig. 1e. Panel a: Fourier spectrogram of electric field data, with frequencies normalized to the local fce. Panel b: sum of the power spectral density at each frequency over the ∼3.5 s burst interval. Horizontal dashed lines show integer multiples of fce. Panels c,d: same data as panels a,b, but spanning a narrower frequency range.
Current usage metrics show cumulative count of Article Views (full-text article views including HTML views, PDF and ePub downloads, according to the available data) and Abstracts Views on Vision4Press platform.
Data correspond to usage on the plateform after 2015. The current usage metrics is available 48-96 hours after online publication and is updated daily on week days.
Initial download of the metrics may take a while.


