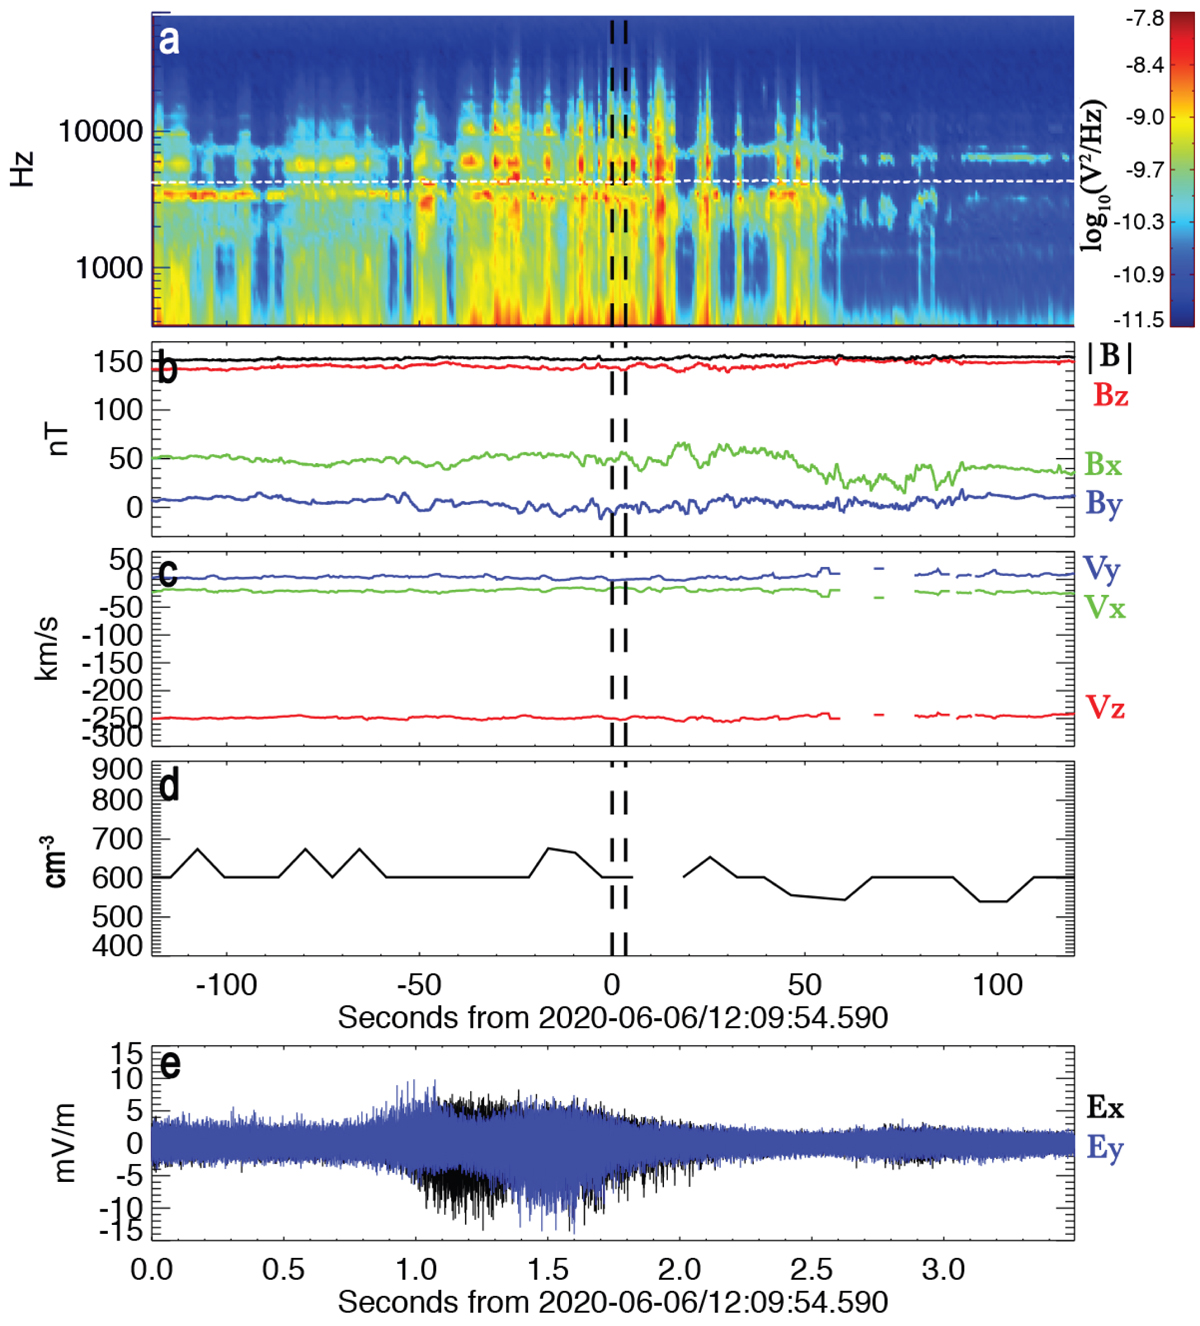
Fig. 1.

Context plasma and magnetic field conditions for the studied interval of near-fce waves. Panel a: spectrogram of the differential voltage signals (V12 + V34). The dashed white line indicates the local electron cyclotron frequency. The dashed vertical black lines indicate the studied burst interval. Panels b,c: ambient magnetic field vector and plasma flow velocity in the spacecraft frame in spacecraft coordinates. Panel d: electron density determined by quasi-thermal noise measurements. Panel e: burst capture electric field time series in spacecraft coordinates.
Current usage metrics show cumulative count of Article Views (full-text article views including HTML views, PDF and ePub downloads, according to the available data) and Abstracts Views on Vision4Press platform.
Data correspond to usage on the plateform after 2015. The current usage metrics is available 48-96 hours after online publication and is updated daily on week days.
Initial download of the metrics may take a while.


