Fig. 2.
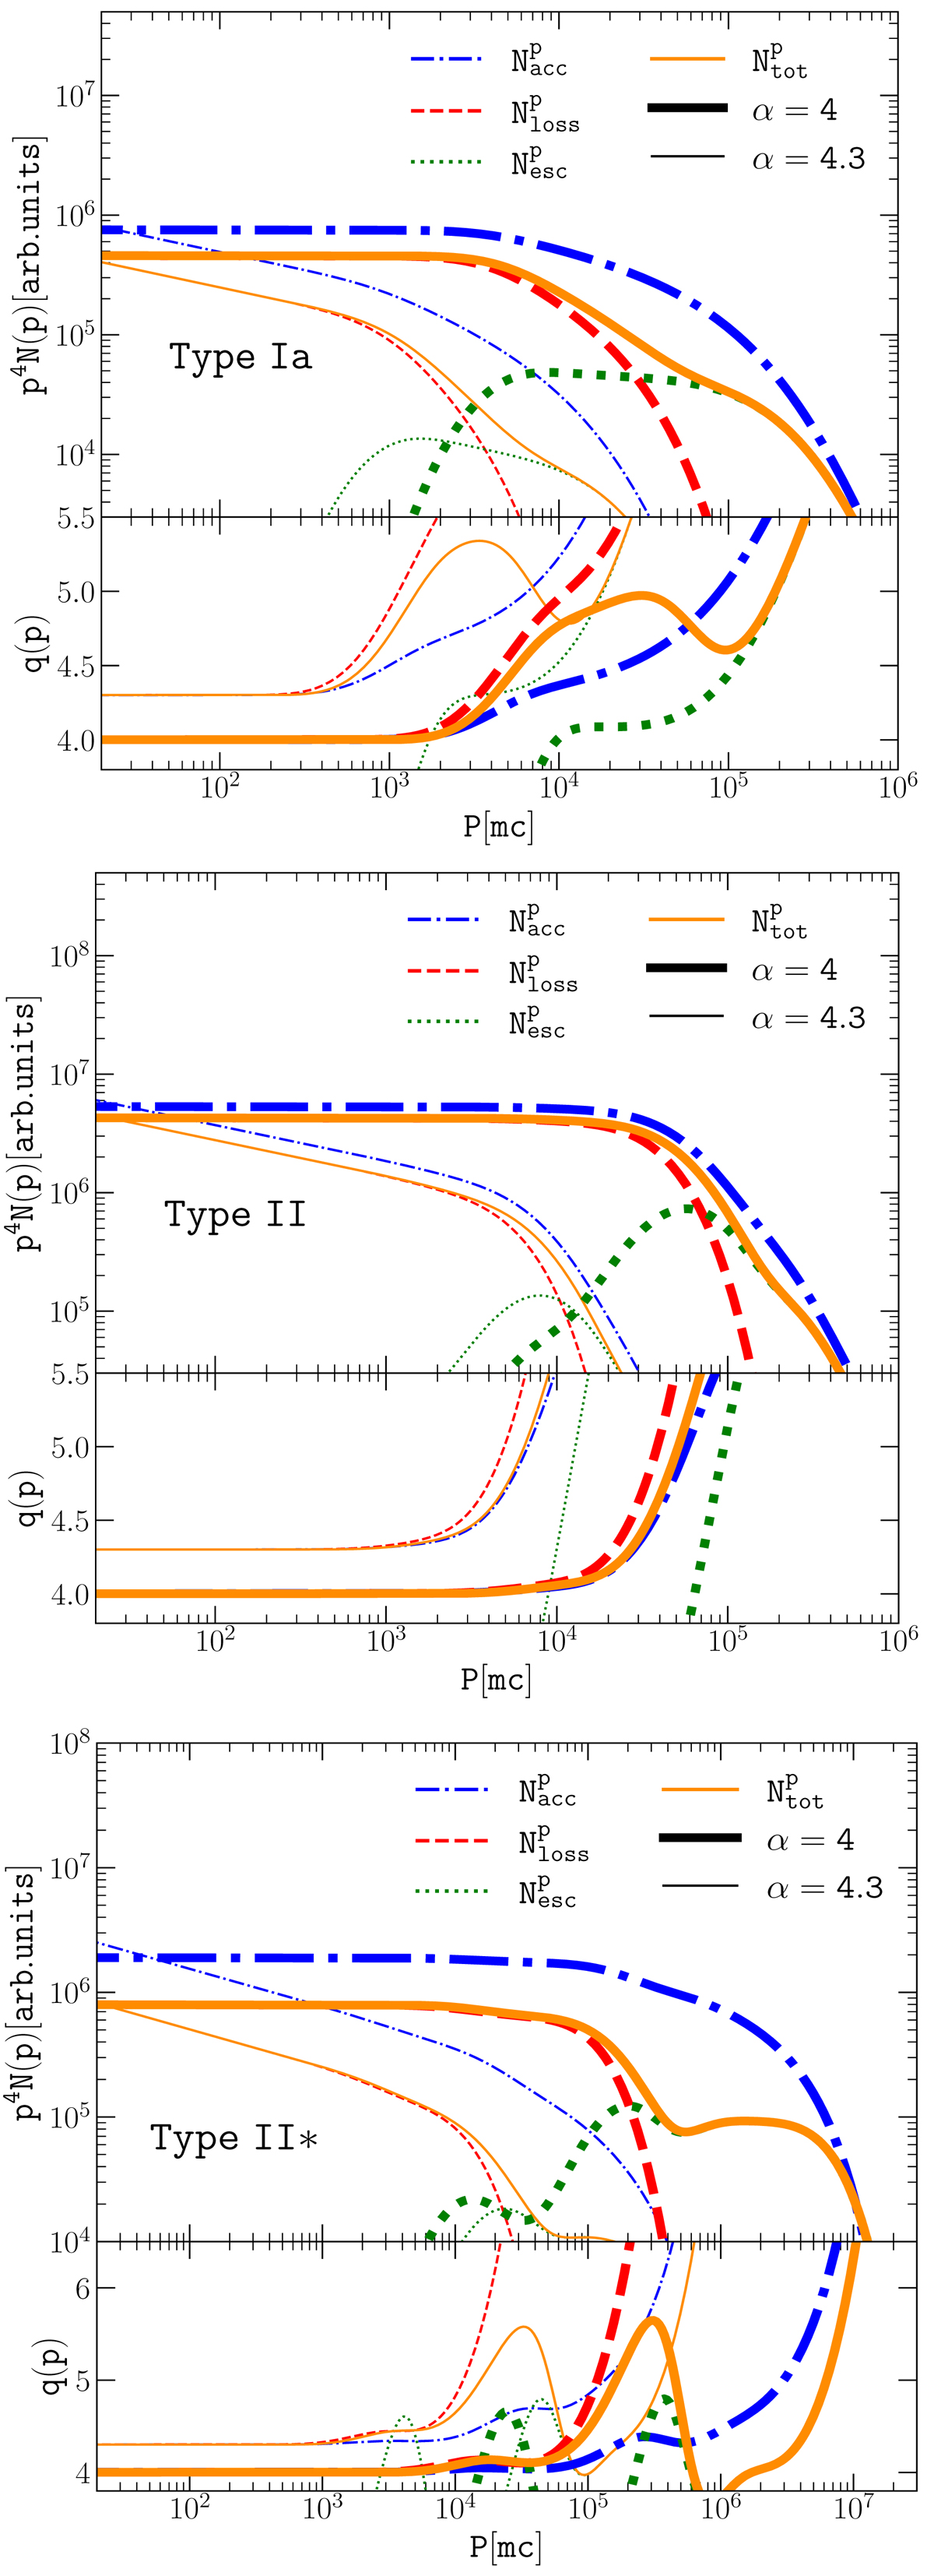
Spectra of protons produced at SNRs from type Ia (top), type II (center), and type II* (bottom) SNRs for α = 4 (thick lines) and α = 4.3 (thin lines) if they were instantaneously liberated into the ISM (broken shell assumption). The dashed curves illustrate the effect of adiabatic losses in the downstream region, while the dotted lines refer to the escape flux from the upstream region. In the bottom part of each panel we also show the local slope of the spectrum q(p) at a given momentum.
Current usage metrics show cumulative count of Article Views (full-text article views including HTML views, PDF and ePub downloads, according to the available data) and Abstracts Views on Vision4Press platform.
Data correspond to usage on the plateform after 2015. The current usage metrics is available 48-96 hours after online publication and is updated daily on week days.
Initial download of the metrics may take a while.