Fig. 3
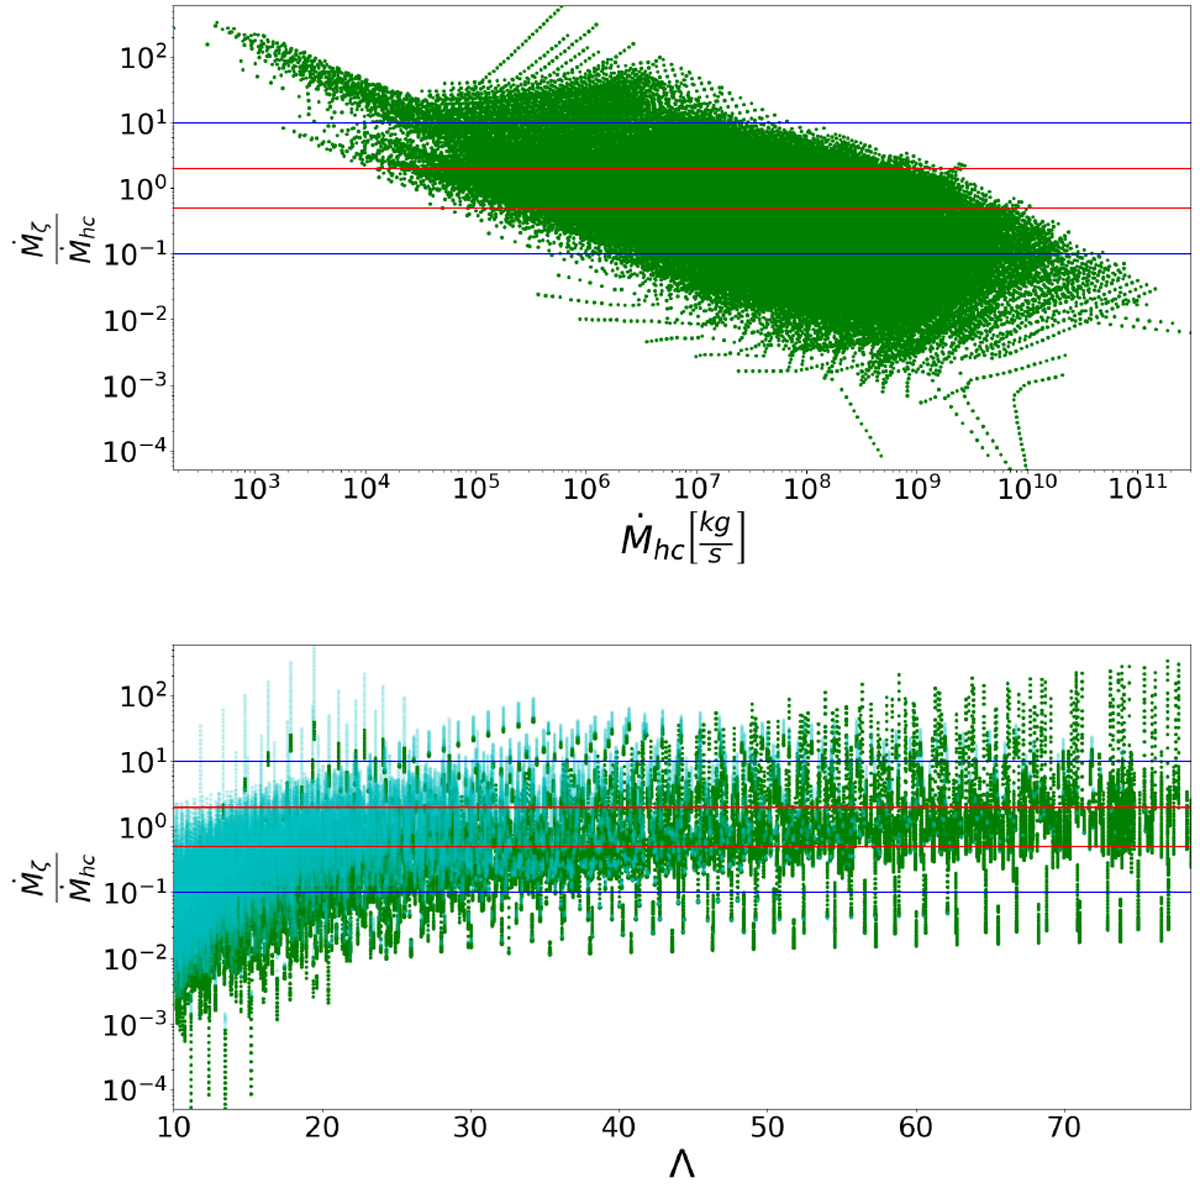
Ratio of the mass-loss rates obtained following the energy-limited formalism (Ṁζ) and from hydrodynamic simulations (Ṁhc). Top: plotted as a function of Ṁhc. Bottom: plotted as a function of Λ. The dark green and bright blue points represent planets that do and do not comply with the subsonic condition, respectively(see Sect. 5.1). In both panels, the red and blue lines mark the regions within which Ṁζ and Ṁhc differ by less than a factor of two and ten, respectively.
Current usage metrics show cumulative count of Article Views (full-text article views including HTML views, PDF and ePub downloads, according to the available data) and Abstracts Views on Vision4Press platform.
Data correspond to usage on the plateform after 2015. The current usage metrics is available 48-96 hours after online publication and is updated daily on week days.
Initial download of the metrics may take a while.