Fig. 5.
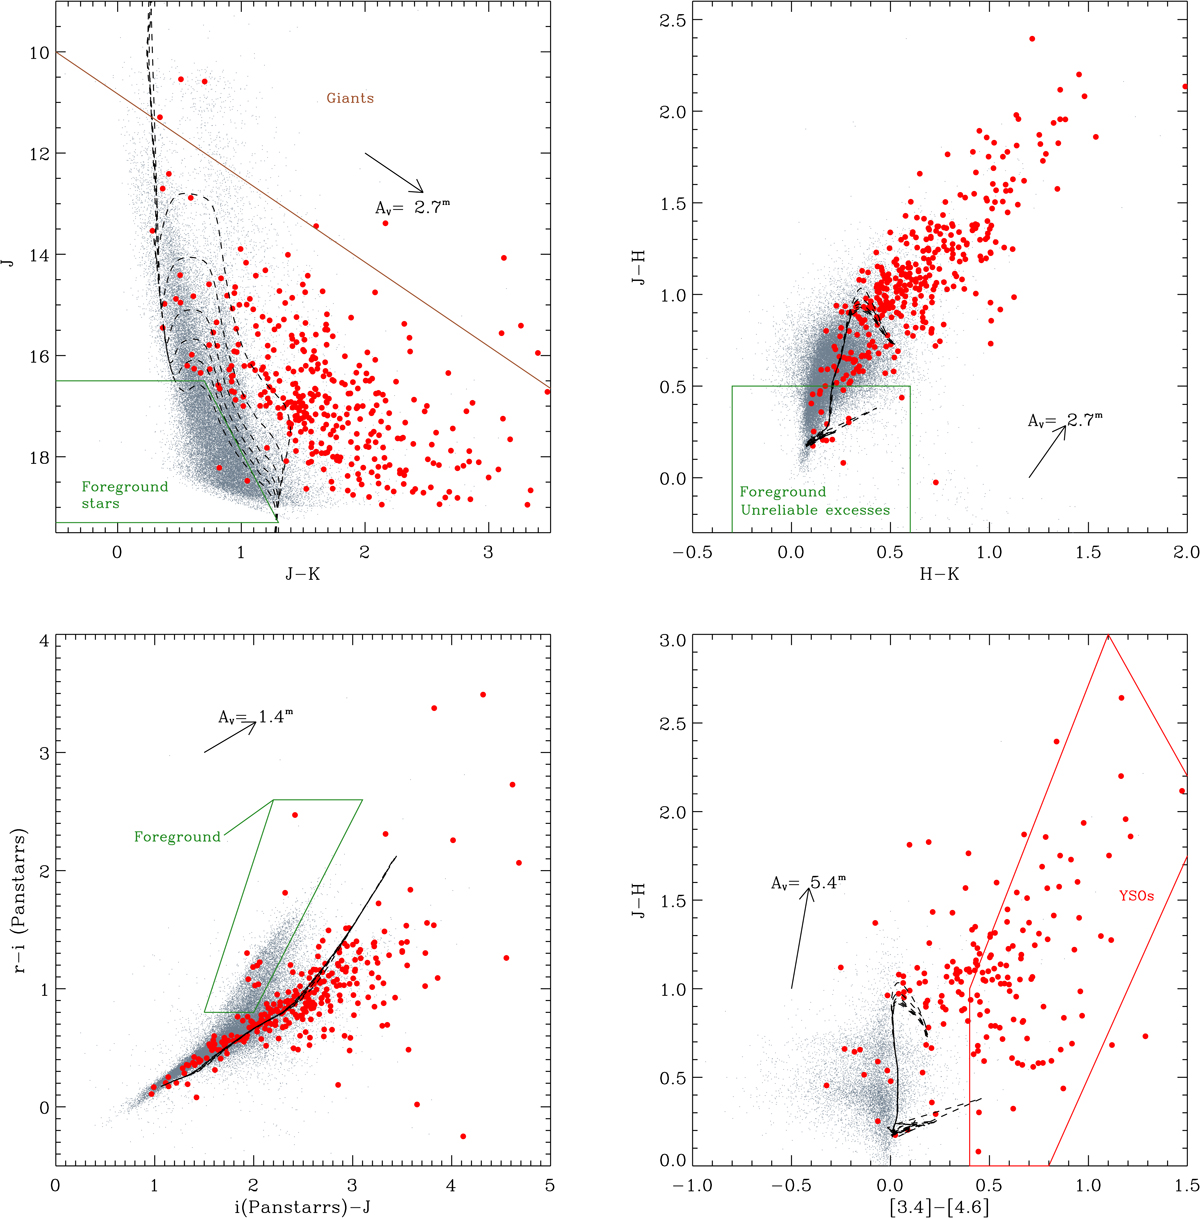
Subset of the infrared and optical-infrared diagrams of all sources in the studied field that meet the criteria of good photometry (e.g., error in magnitude smaller than 0.1m and in color smaller than 0.15m). The dashed lines show the isochrones for ages 0.5 Myr, 1.5 Myr, 3 Myr, 5 Myr, 8 Myr, and 10 Myr, and with metallicity Z = 0.004 (Delgado et al. 2010) from the PARSEC models, plotted adopting a distance of 4.5 kpc and AV = 2.7m. Red dots mark the selected stars with a disk that we retained in the final list. We also show the loci defined to select stars with a disk and contaminants, delimited by red and green lines. In particular, we show the loci expected to be populated by giants, stars with unreliable excesses, foreground stars, and YSOs with a disk in these diagrams. All diagrams are shown in Appendix D.
Current usage metrics show cumulative count of Article Views (full-text article views including HTML views, PDF and ePub downloads, according to the available data) and Abstracts Views on Vision4Press platform.
Data correspond to usage on the plateform after 2015. The current usage metrics is available 48-96 hours after online publication and is updated daily on week days.
Initial download of the metrics may take a while.