Fig. E.2.
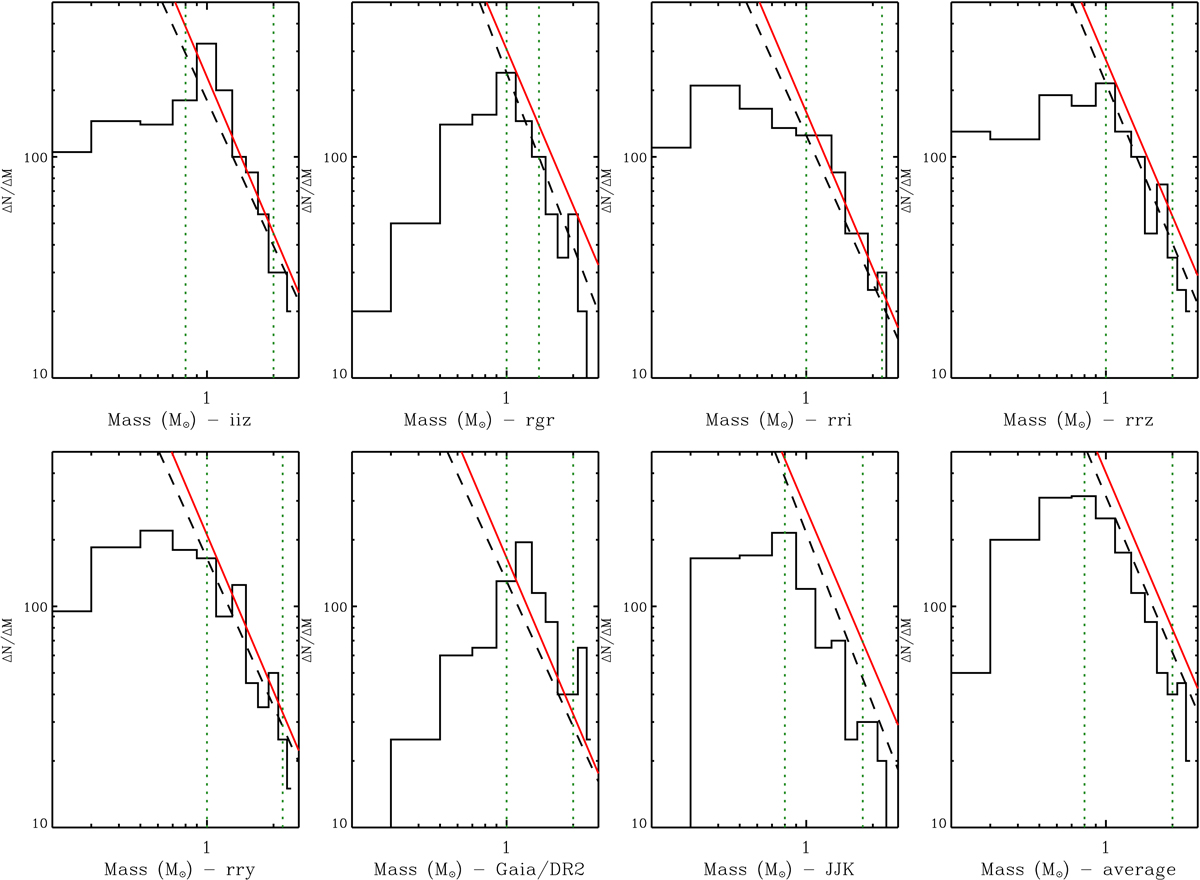
Mass function distributions of both disk-less and disk-bearing candidate members of Dolidze 25 (the latter considered only if they were inside the ACIS field) obtained from each of the adopted diagrams. The solid black line is obtained from a linear fit in the log–log space on the mass distribution between the two limits marked with the vertical lines. The red line shows the normalized Salpeter–Kroupa IMF with α = 2.35 (Kroupa & Weidner 2003). The range of completeness and the shape of the mass distribution change slightly when individual masses are estimated from different diagrams. The average distribution is obtained by averaging the values obtained from the adopted diagrams for each star.
Current usage metrics show cumulative count of Article Views (full-text article views including HTML views, PDF and ePub downloads, according to the available data) and Abstracts Views on Vision4Press platform.
Data correspond to usage on the plateform after 2015. The current usage metrics is available 48-96 hours after online publication and is updated daily on week days.
Initial download of the metrics may take a while.