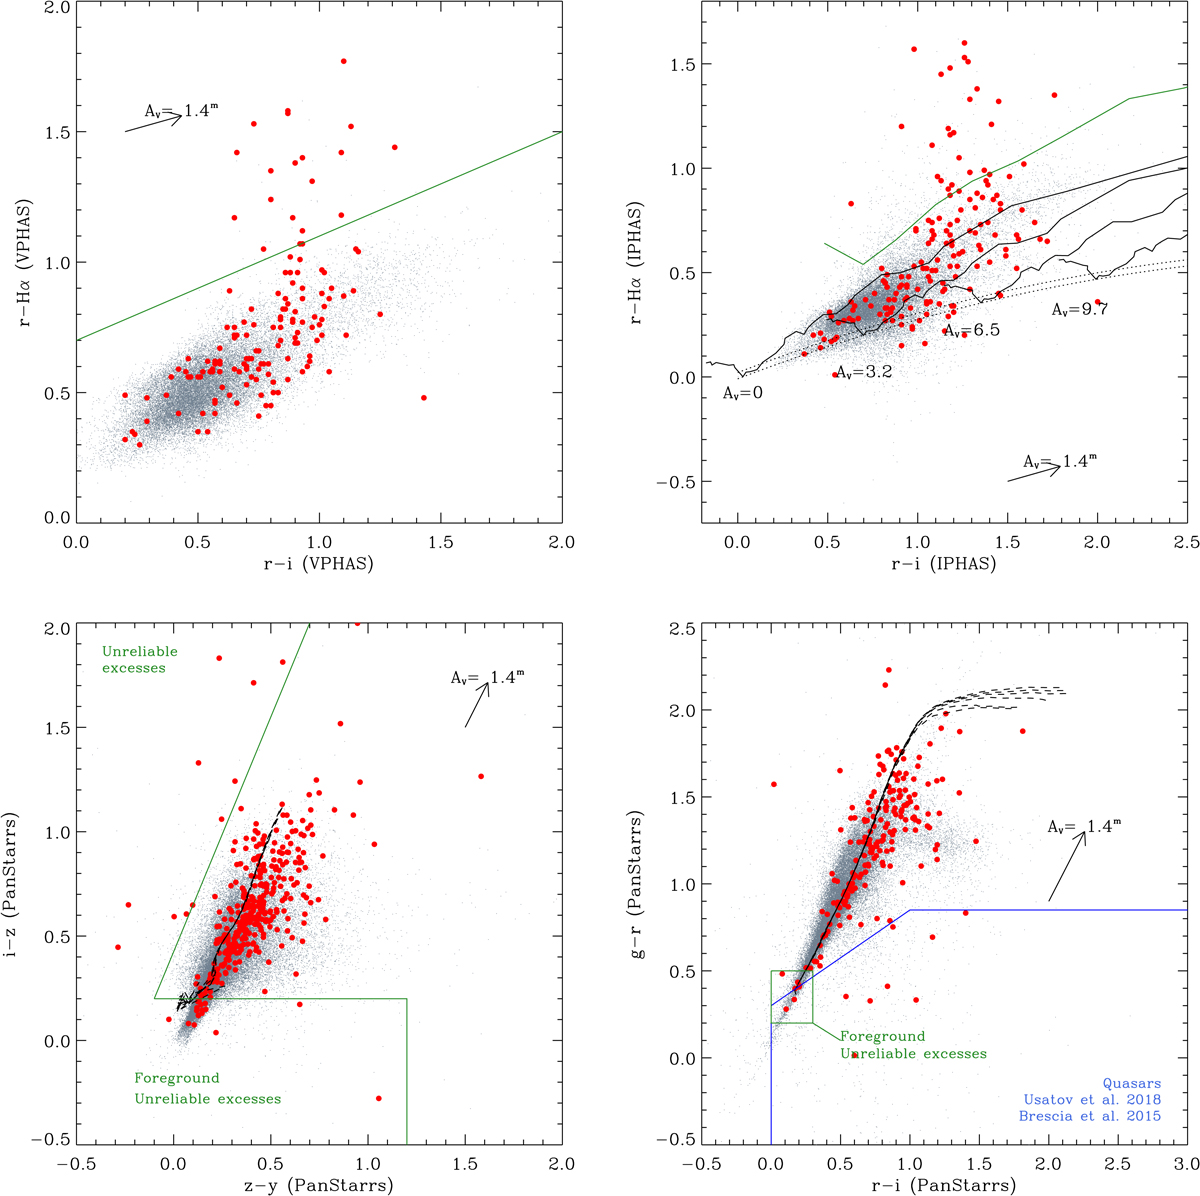
Fig. D.3.

Optical color–color diagrams of all sources in the studied field that meet the criteria of good photometry. Figure layout and symbols are the same as in Fig. 5. We show the loci that are expected to be populated by accreting stars with a disk, stars with unreliable infrared excesses, and possible foreground stars. In the IPHAS r − Hα vs. r − i diagram, the solid black lines are ZAMS at increasing extinction, and the dashed lines mark the locus of A stars, as defined by Drew et al. (2005). The solid green line is a ZAMS with EWHα = −40 Å and EB − V = 1 defined by Barentsen et al. (2011).
Current usage metrics show cumulative count of Article Views (full-text article views including HTML views, PDF and ePub downloads, according to the available data) and Abstracts Views on Vision4Press platform.
Data correspond to usage on the plateform after 2015. The current usage metrics is available 48-96 hours after online publication and is updated daily on week days.
Initial download of the metrics may take a while.


