Fig. 2.
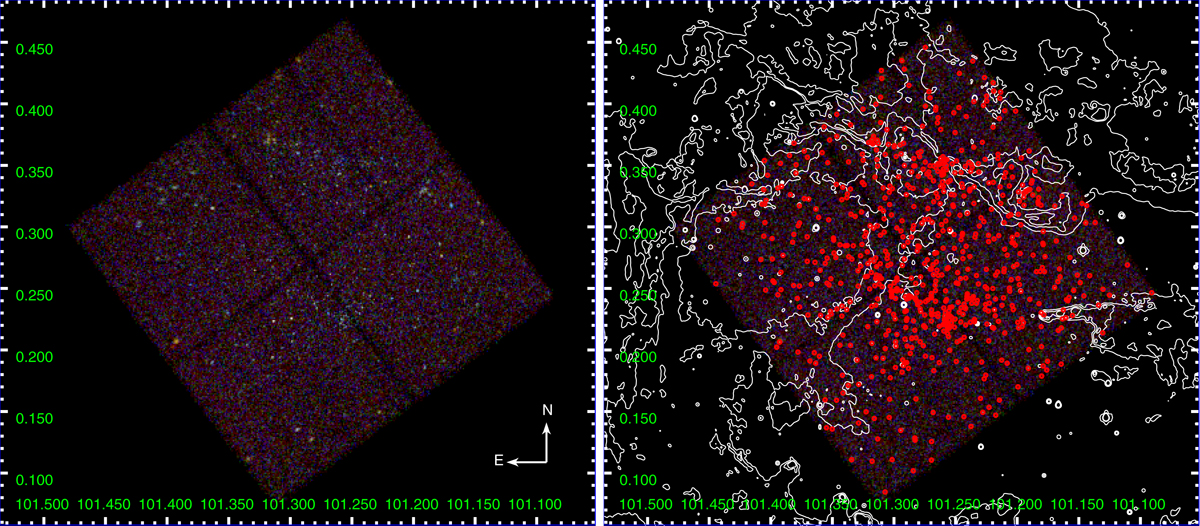
Combined Chandra ACIS-I Images of Dolidze 25. In the left panel, we show an RBG image, with events in the hard energy band marked in red, those in the medium band (1.21–1.99 keV) are plotted in green, and those in the soft band are shown in blue. In the right panel, the white polygons mark the contours of the continuum emission at 8 μm from Spitzer-IRAC, while the red circles mark the position of the validated X-ray sources.
Current usage metrics show cumulative count of Article Views (full-text article views including HTML views, PDF and ePub downloads, according to the available data) and Abstracts Views on Vision4Press platform.
Data correspond to usage on the plateform after 2015. The current usage metrics is available 48-96 hours after online publication and is updated daily on week days.
Initial download of the metrics may take a while.