Fig. 16.
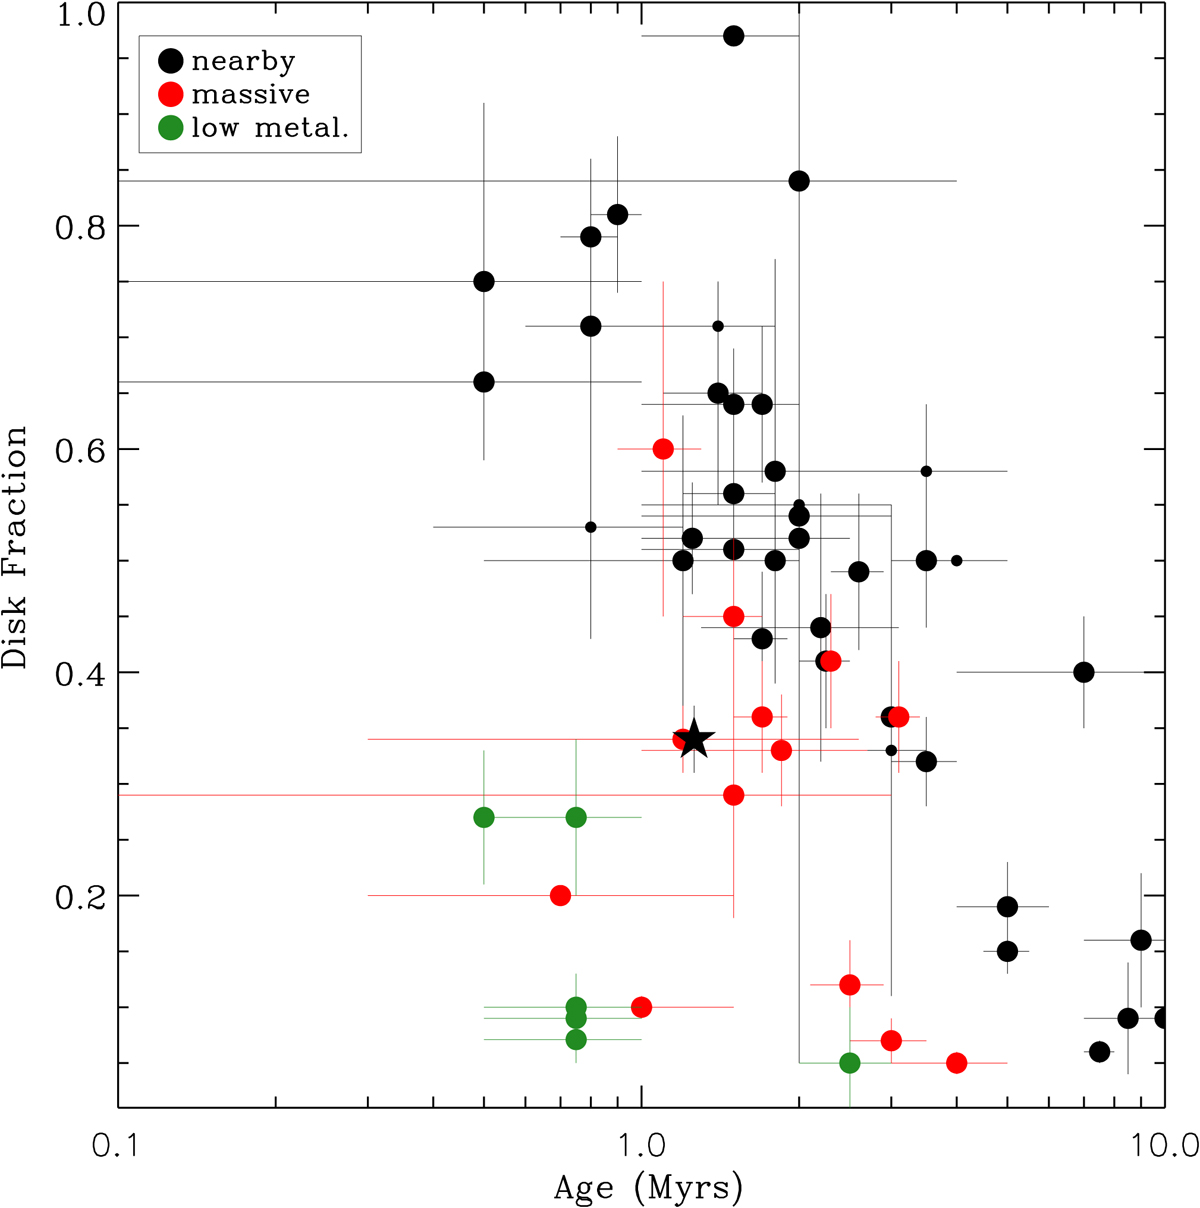
Disk fraction vs. age of 58 clusters with ages between 0 and 10 Myr. Nearby clusters, e.g., closer than 1 kpc to the Sun, are marked with large black dots, massive clusters are marked with red dots, and the low-metallicity star-forming regions studied by Yasui et al. (2010) are plotted in green. The average estimate of the disk fraction in Dolidze 25 we obtained by accounting for completeness is marked with stars.
Current usage metrics show cumulative count of Article Views (full-text article views including HTML views, PDF and ePub downloads, according to the available data) and Abstracts Views on Vision4Press platform.
Data correspond to usage on the plateform after 2015. The current usage metrics is available 48-96 hours after online publication and is updated daily on week days.
Initial download of the metrics may take a while.