Fig. 12.
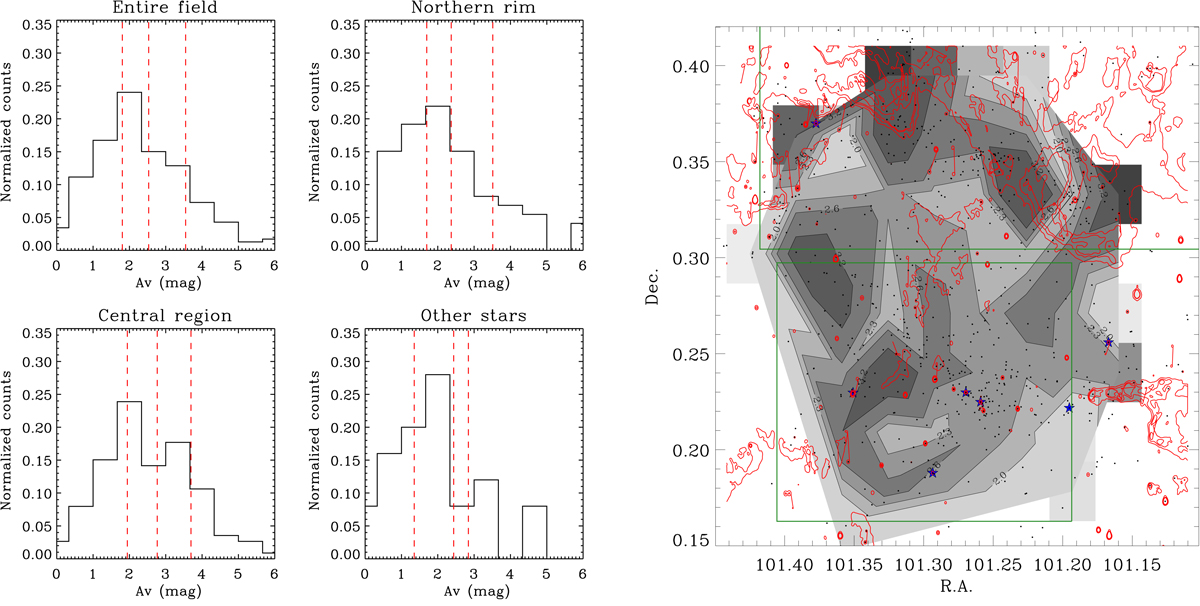
Left: distribution of the individual extinctions of all disk-less members. We separately plot those for sources in the central cluster, northern group, and in the sparse population. The vertical lines mark the median and the 25% and 75% quantiles of each distribution. Right: extinction map in the ACIS field. The red lines mark the emission level at 8.0 μm from IRAC images. The green boxes roughly delimit the central and northern groups.
Current usage metrics show cumulative count of Article Views (full-text article views including HTML views, PDF and ePub downloads, according to the available data) and Abstracts Views on Vision4Press platform.
Data correspond to usage on the plateform after 2015. The current usage metrics is available 48-96 hours after online publication and is updated daily on week days.
Initial download of the metrics may take a while.