Fig. 9.
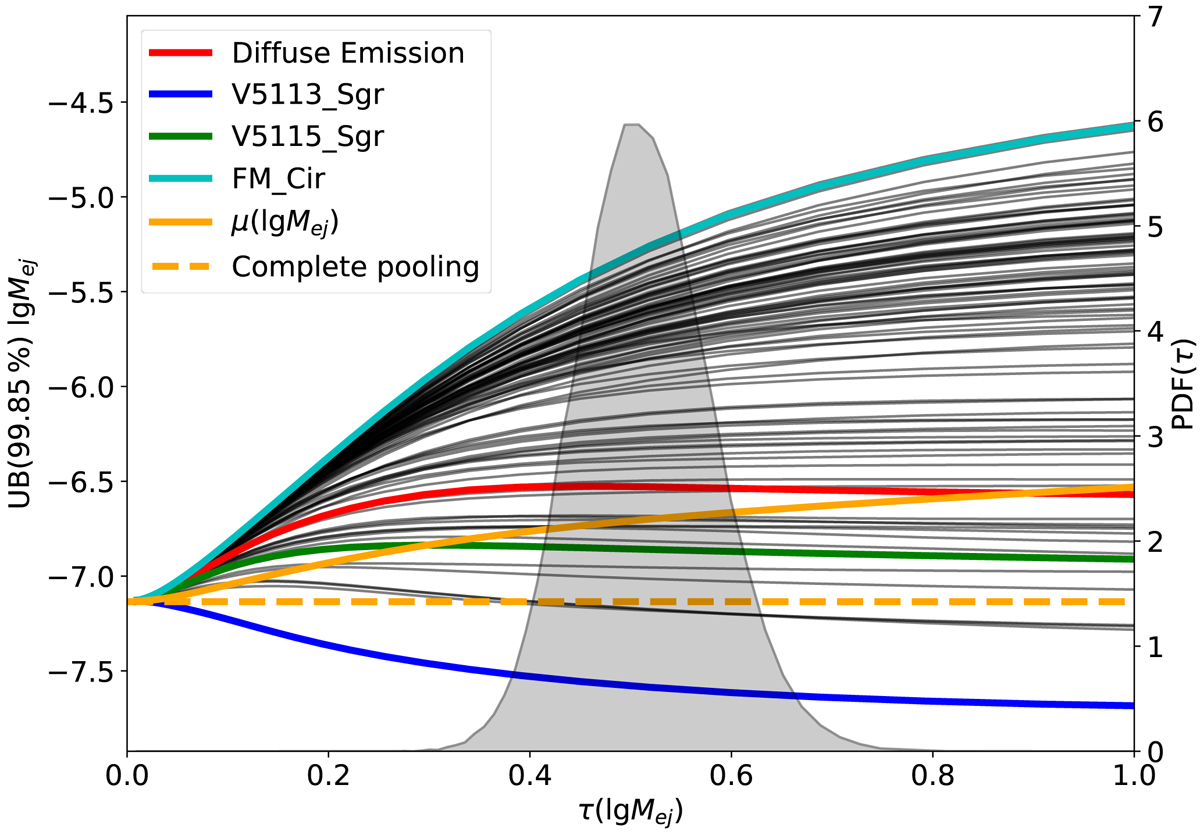
Summary of the hierarchical model. Shown are the upper bounds on the 22Na ejecta masses (left axis) for individual objects (black) as a function of the population width τ, together with the complete pooling estimate (τ → 0, dashed orange), and the population mean μ (solid orange). Individual objects of interest (best (blue) worst (aqua) bound, diffuse emission (red)) are indicated. As τ → ∞, each upper bound converges to its no pooling value (Table B.1). Given the SPI flux posteriors, a population width of ![]() (right axis, grey shaded) is found. This value is dominated by the flux uncertainties.
(right axis, grey shaded) is found. This value is dominated by the flux uncertainties.
Current usage metrics show cumulative count of Article Views (full-text article views including HTML views, PDF and ePub downloads, according to the available data) and Abstracts Views on Vision4Press platform.
Data correspond to usage on the plateform after 2015. The current usage metrics is available 48-96 hours after online publication and is updated daily on week days.
Initial download of the metrics may take a while.