Fig. 8.
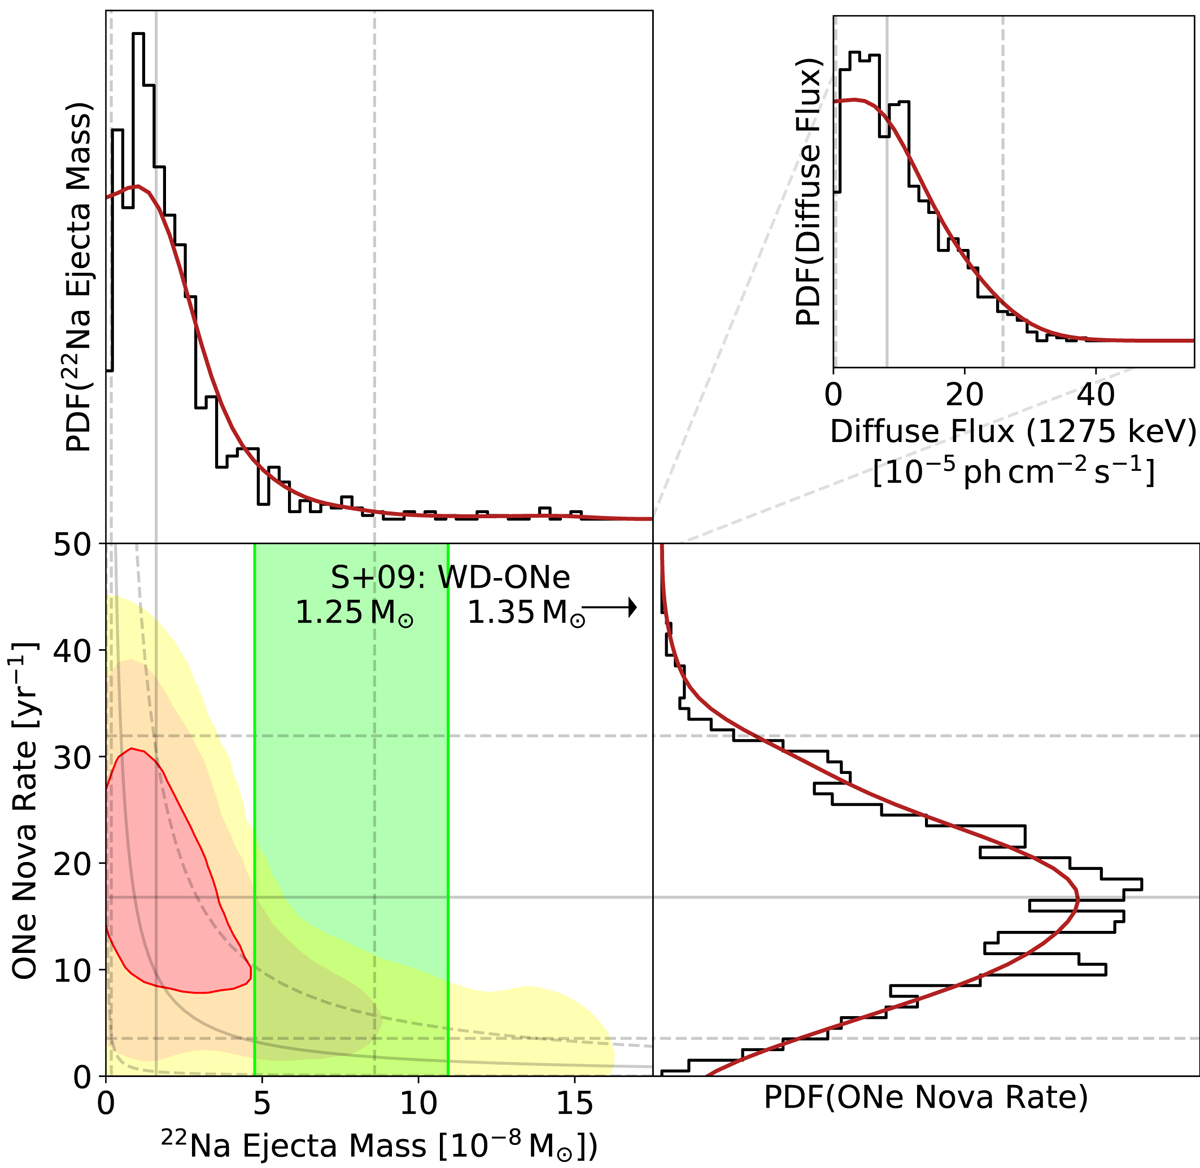
Posterior distributions for diffuse emission of the 1275 keV line. The flux (top right) is separated into its two determining components, the 22Na ejecta mass (top left) and the ONe nova rate (bottom right, treated as a nuisance parameter). Theoretical predictions are indicated in green from Starrfield et al. (2009). The joint posterior (68.3th, 95.4th, and 99.7th percentile) of ejecta mass and nova rate (bottom left) shows the expected anticorrelated behaviour according to Eq. (17).
Current usage metrics show cumulative count of Article Views (full-text article views including HTML views, PDF and ePub downloads, according to the available data) and Abstracts Views on Vision4Press platform.
Data correspond to usage on the plateform after 2015. The current usage metrics is available 48-96 hours after online publication and is updated daily on week days.
Initial download of the metrics may take a while.