Fig. 4.
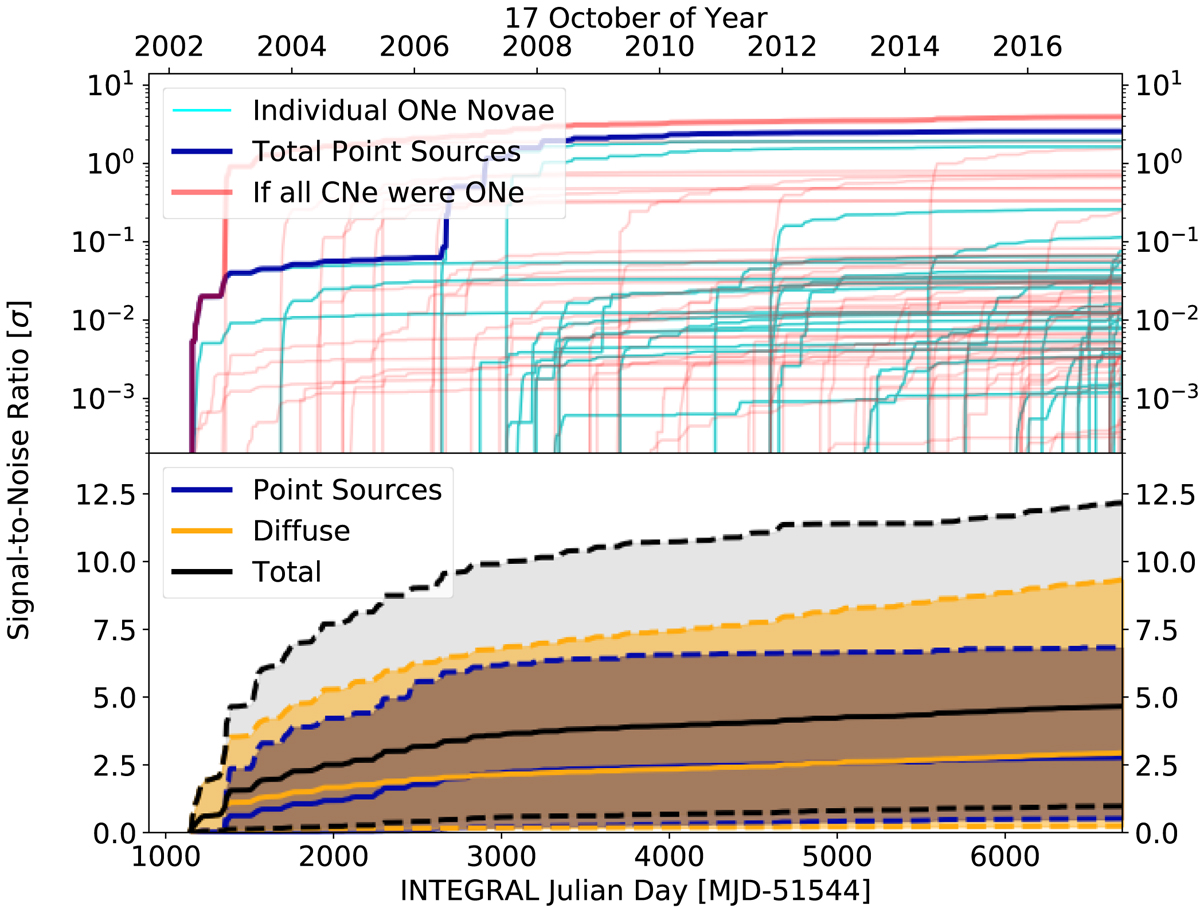
Estimated S/N given the SPI data set (Sect. 3) and the range of plausible 22Na ejecta masses for our sample of 97 novae. Top: the S/N of individual objects does not increase with ![]() because the exponential decay is faster than the accumulation of 1275 keV photons (cyan lines). The cumulative signal of point sources saturates on a timescale of a few years (dark blue). If all objects are assumed to be ONe novae, the S/N would be about three times higher (pale red). Bottom: comparison between cumulative point-source emission significance and diffuse-emission significance during the INTEGRAL mission timescale. The bands contain the 68th percentile from 1000 realisations of the population synthesis model (boundaries marked by dashed lines, median by solid lines; Sect. 2.4), to distribute ejecta masses among sources and diffuse emission.
because the exponential decay is faster than the accumulation of 1275 keV photons (cyan lines). The cumulative signal of point sources saturates on a timescale of a few years (dark blue). If all objects are assumed to be ONe novae, the S/N would be about three times higher (pale red). Bottom: comparison between cumulative point-source emission significance and diffuse-emission significance during the INTEGRAL mission timescale. The bands contain the 68th percentile from 1000 realisations of the population synthesis model (boundaries marked by dashed lines, median by solid lines; Sect. 2.4), to distribute ejecta masses among sources and diffuse emission.
Current usage metrics show cumulative count of Article Views (full-text article views including HTML views, PDF and ePub downloads, according to the available data) and Abstracts Views on Vision4Press platform.
Data correspond to usage on the plateform after 2015. The current usage metrics is available 48-96 hours after online publication and is updated daily on week days.
Initial download of the metrics may take a while.