Free Access
Fig. 2.
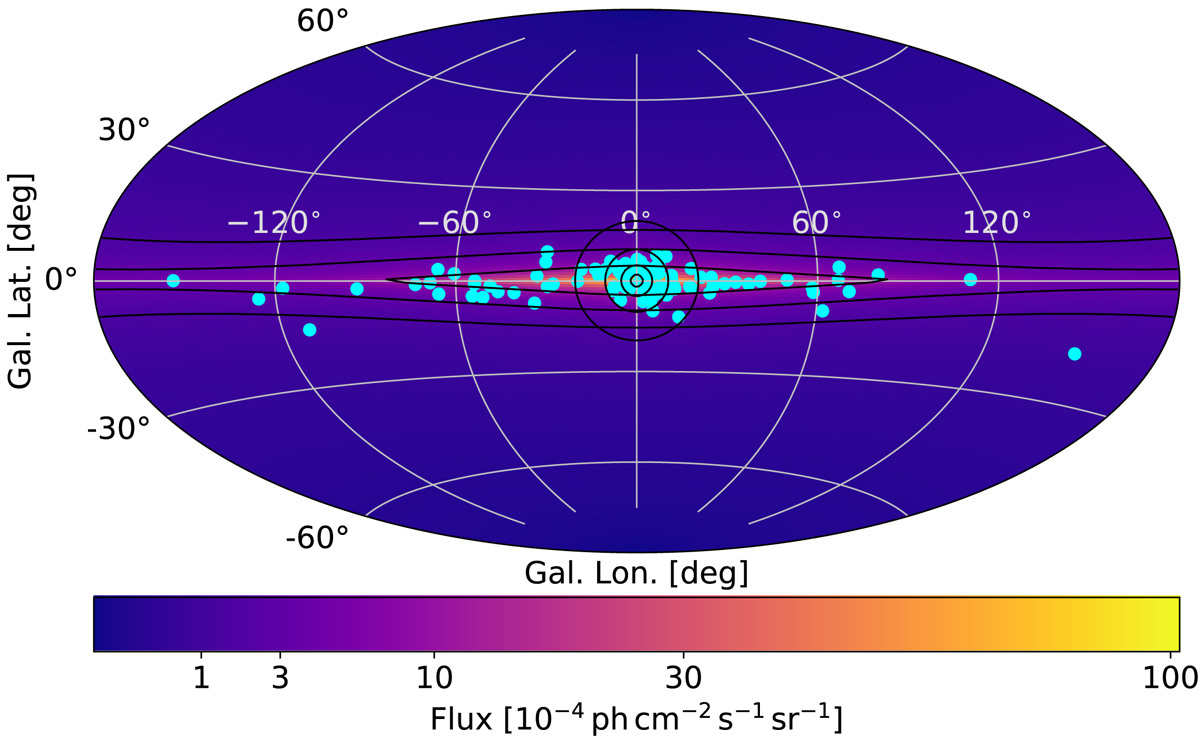
Diffuse emission template from line-of-sight-integrated nova density distribution, Eq. (15), together with nova sample (cyan points). The contours indicate the De Vaucouleurs profile for the bulge and the exponential disc.
Current usage metrics show cumulative count of Article Views (full-text article views including HTML views, PDF and ePub downloads, according to the available data) and Abstracts Views on Vision4Press platform.
Data correspond to usage on the plateform after 2015. The current usage metrics is available 48-96 hours after online publication and is updated daily on week days.
Initial download of the metrics may take a while.