Fig. 1.
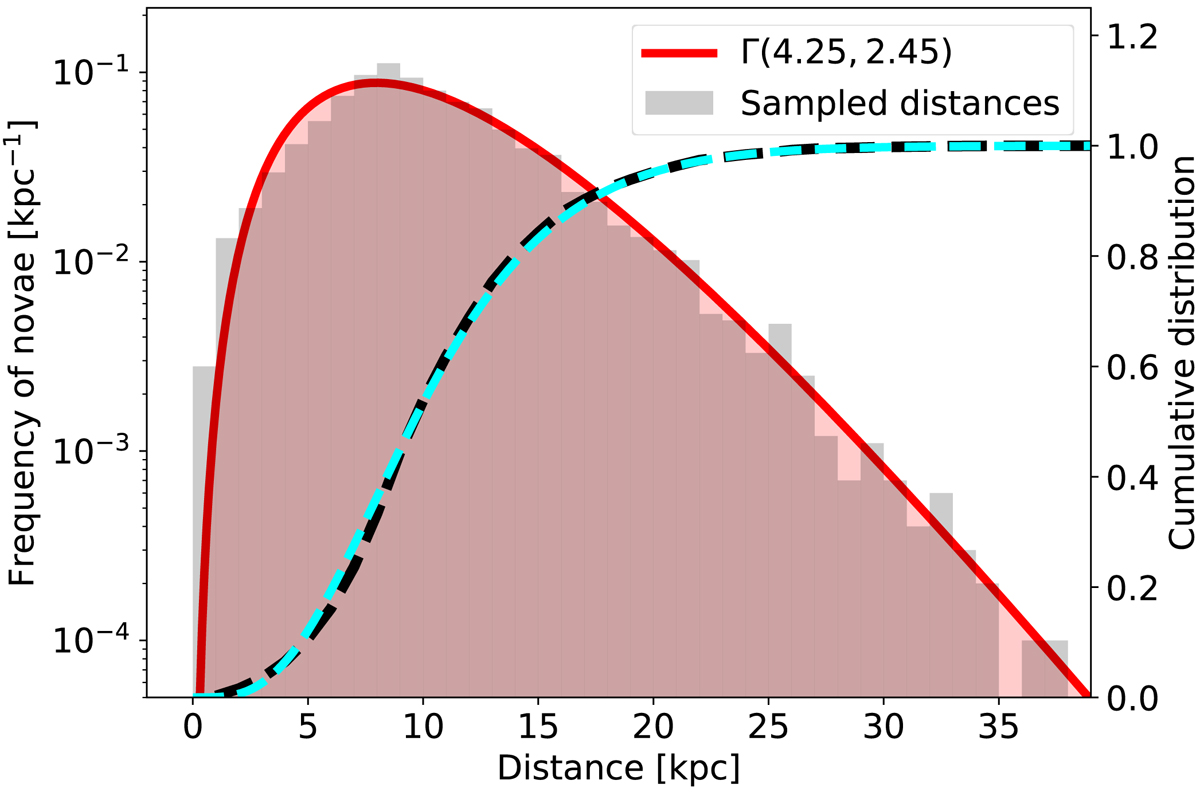
Distance distribution of CNe according to Eqs. (9) and (10) through rejection sampling. Shown are 104 samples (grey histogram, corresponding to a timescale of 200 yr, left axis), and an approximation with the Γ-distribution in red. The cumulative distributions are shown in black for the sample and in cyan for the Γ-distribution (right axis).
Current usage metrics show cumulative count of Article Views (full-text article views including HTML views, PDF and ePub downloads, according to the available data) and Abstracts Views on Vision4Press platform.
Data correspond to usage on the plateform after 2015. The current usage metrics is available 48-96 hours after online publication and is updated daily on week days.
Initial download of the metrics may take a while.