Fig. 7.
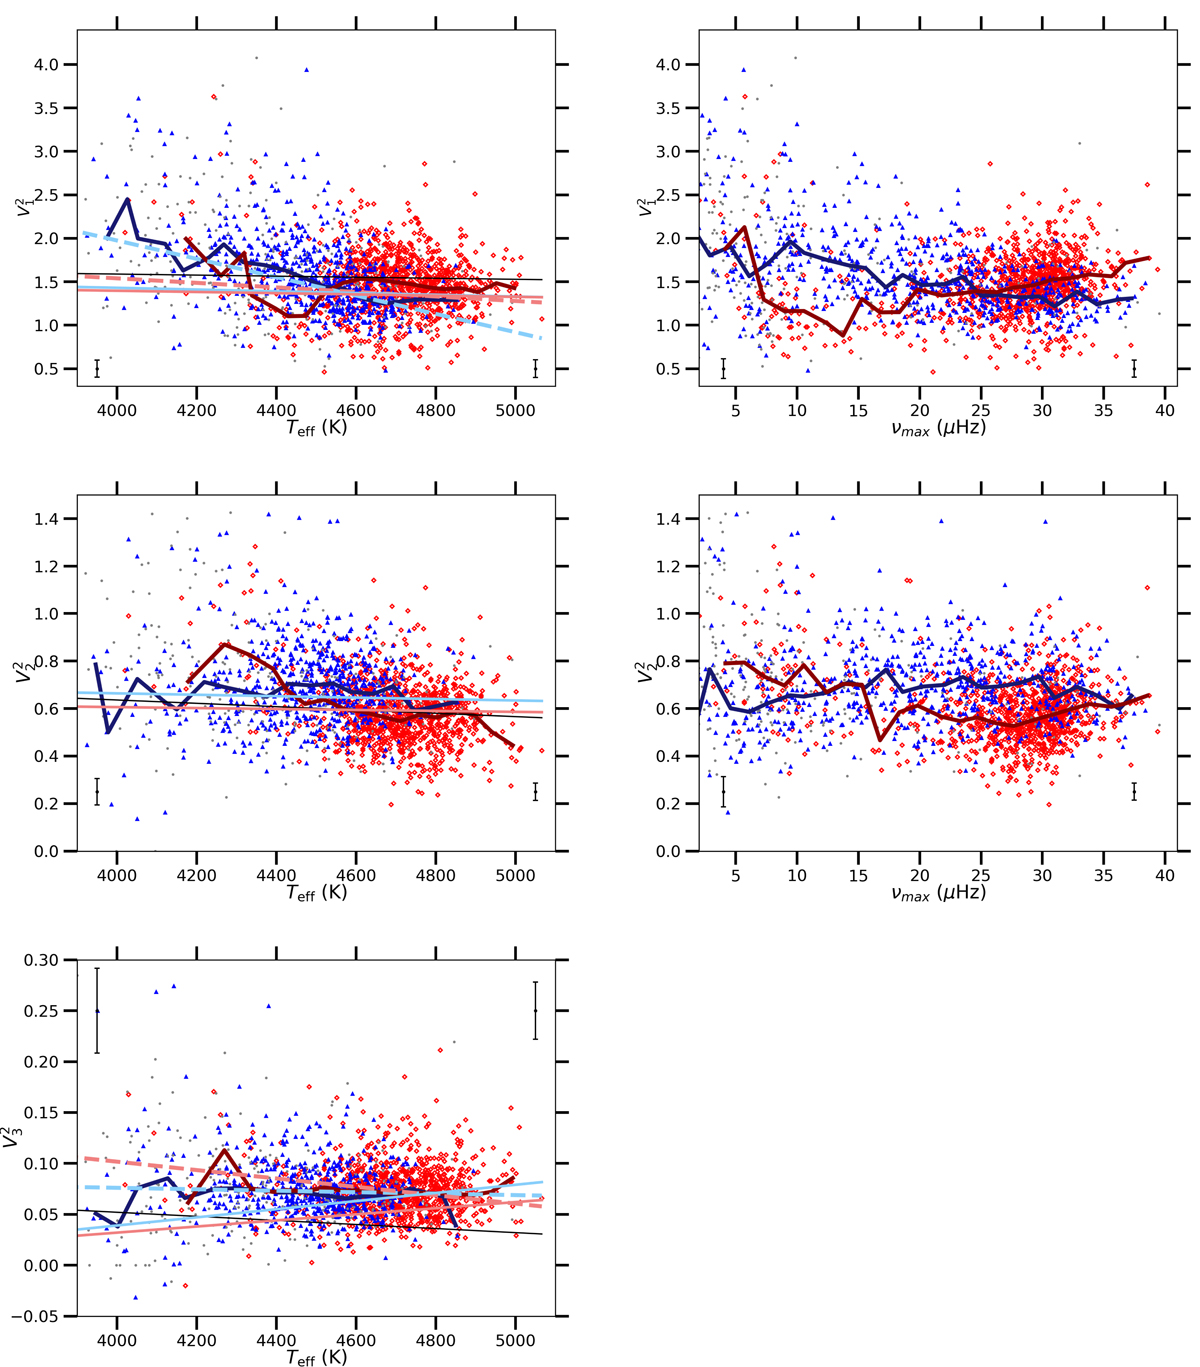
Upper panels: visibility of the ℓ = 1 modes as a function of Teff in the left panel and of νmax in the right panel. The colours and symbols are the same as in Fig. 5. The error bars are computed in the same way as in Fig. 5. Similarly, error bars on the visibilities are given for both low νmax (νmax ≤ 4.5 μHz) and high νmax (νmax ≥ 4.5 μHz). The dashed lines are the fits presented in Table 4, in light blue for RGB stars and in light red for He-burning stars. The thin solid light blue and light red lines are the fits obtained for less evolved stars (Mosser et al. 2012) for RGB stars and for He-burning stars, respectively. The thin solid black line is the theoretical prediction (Ballot et al. 2011b). Middle panels: same labels as in the upper panels, but for the visibility of ℓ = 2. Lower left panel: same labels as in the upper left panel, but for the visibility of ℓ = 3 modes. The median values are computed in 50 K wide Teff bins and in 1.5 μHz wide νmax bins.
Current usage metrics show cumulative count of Article Views (full-text article views including HTML views, PDF and ePub downloads, according to the available data) and Abstracts Views on Vision4Press platform.
Data correspond to usage on the plateform after 2015. The current usage metrics is available 48-96 hours after online publication and is updated daily on week days.
Initial download of the metrics may take a while.