Open Access
Fig. 6.
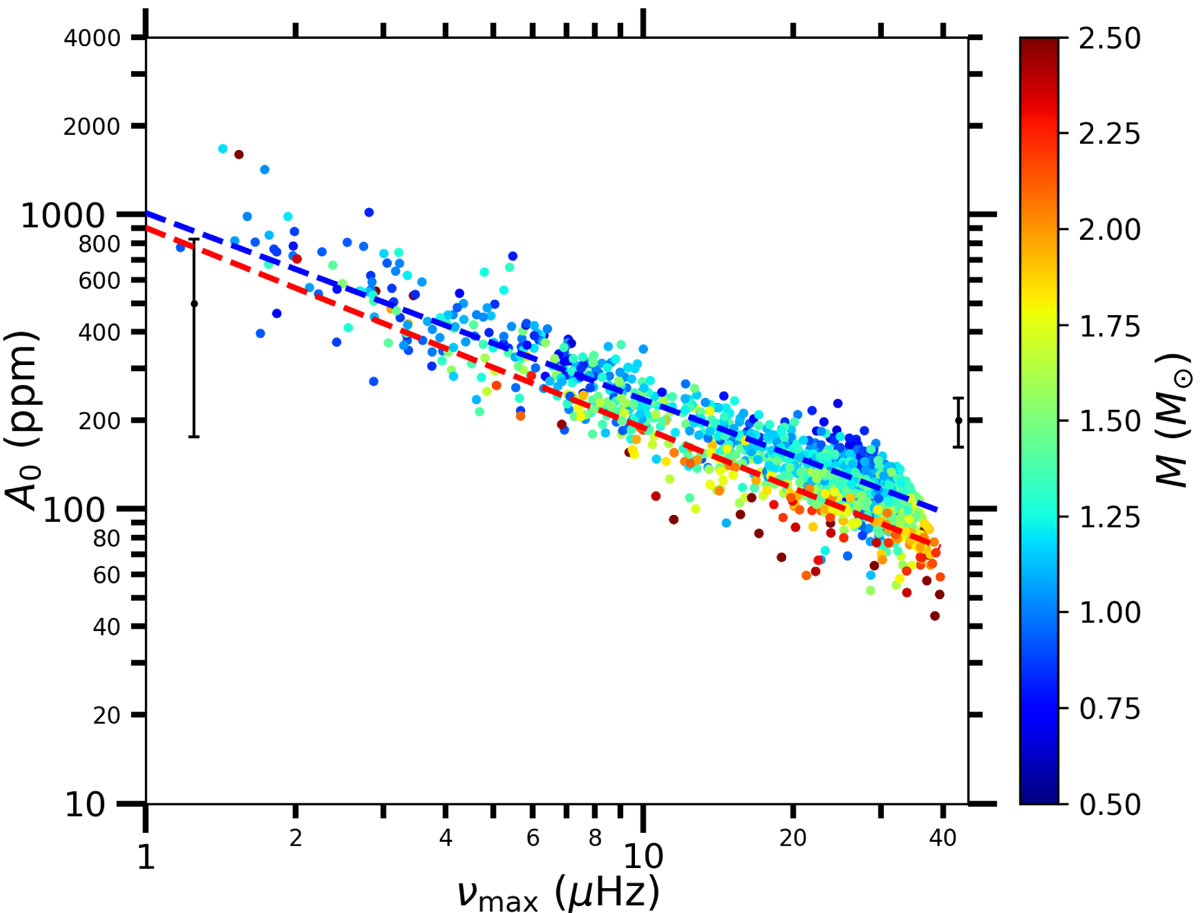
Radial mode amplitude ⟨A0, bol⟩ computed from Eq. (13) as a function of νmax with the stellar mass colour-coded. The dashed lines are the fits presented in Table 3, shown in blue for low-mass stars (M ≤ 1.2 M⊙) and in red for high-mass stars (M ≥ 1.2 M⊙). The error bars are computed in the same way as in Fig. 5.
Current usage metrics show cumulative count of Article Views (full-text article views including HTML views, PDF and ePub downloads, according to the available data) and Abstracts Views on Vision4Press platform.
Data correspond to usage on the plateform after 2015. The current usage metrics is available 48-96 hours after online publication and is updated daily on week days.
Initial download of the metrics may take a while.