Open Access
Fig. 10.
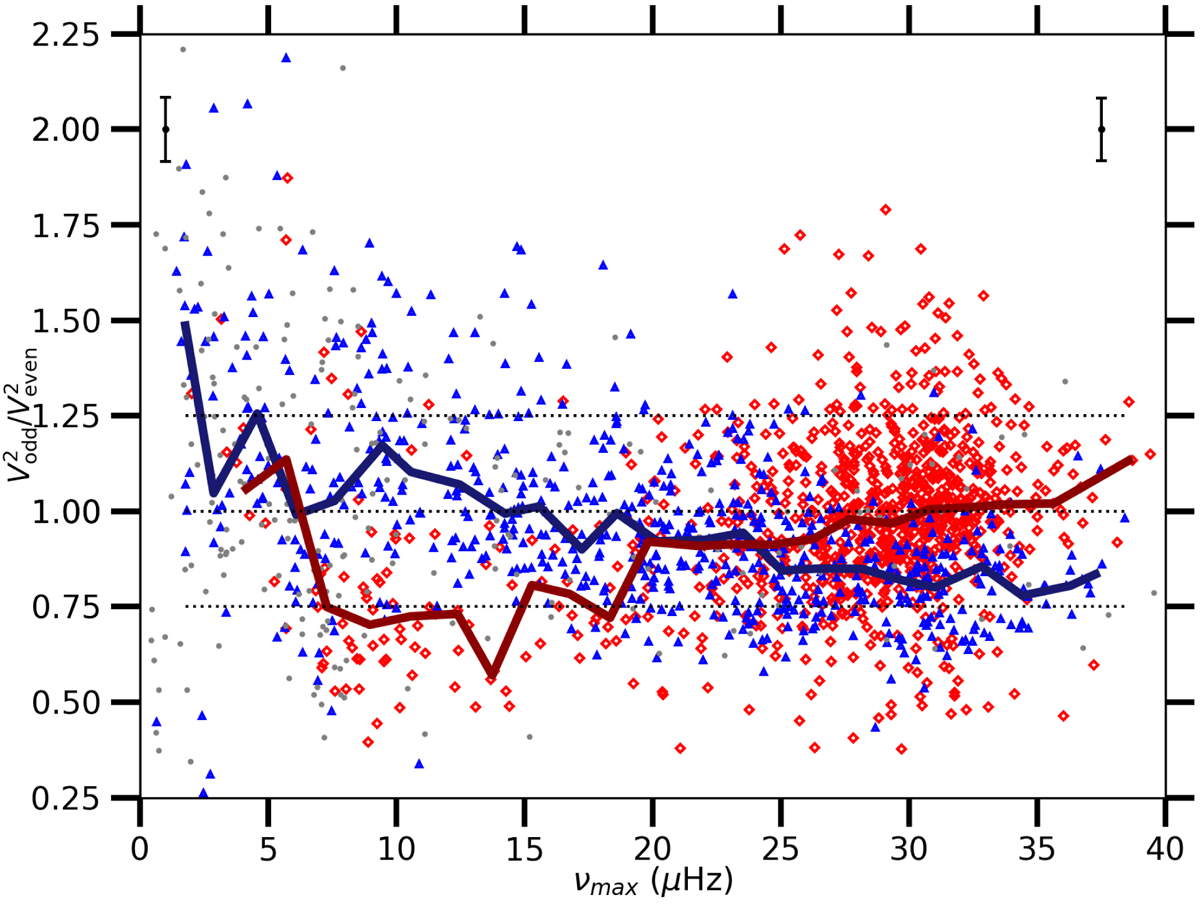
Ratio of the mode visibilities of odd and even degrees as a function of νmax. Same labels as in Fig. 4. For convenience, horizontal dashed black lines are plotted at specific values of 0.75, 1.00, and 1.25. The error bars are computed in the same way as in Fig. 3. The median values are computed in 1.5 μHz νmax bins.
Current usage metrics show cumulative count of Article Views (full-text article views including HTML views, PDF and ePub downloads, according to the available data) and Abstracts Views on Vision4Press platform.
Data correspond to usage on the plateform after 2015. The current usage metrics is available 48-96 hours after online publication and is updated daily on week days.
Initial download of the metrics may take a while.