Open Access
Fig. 1
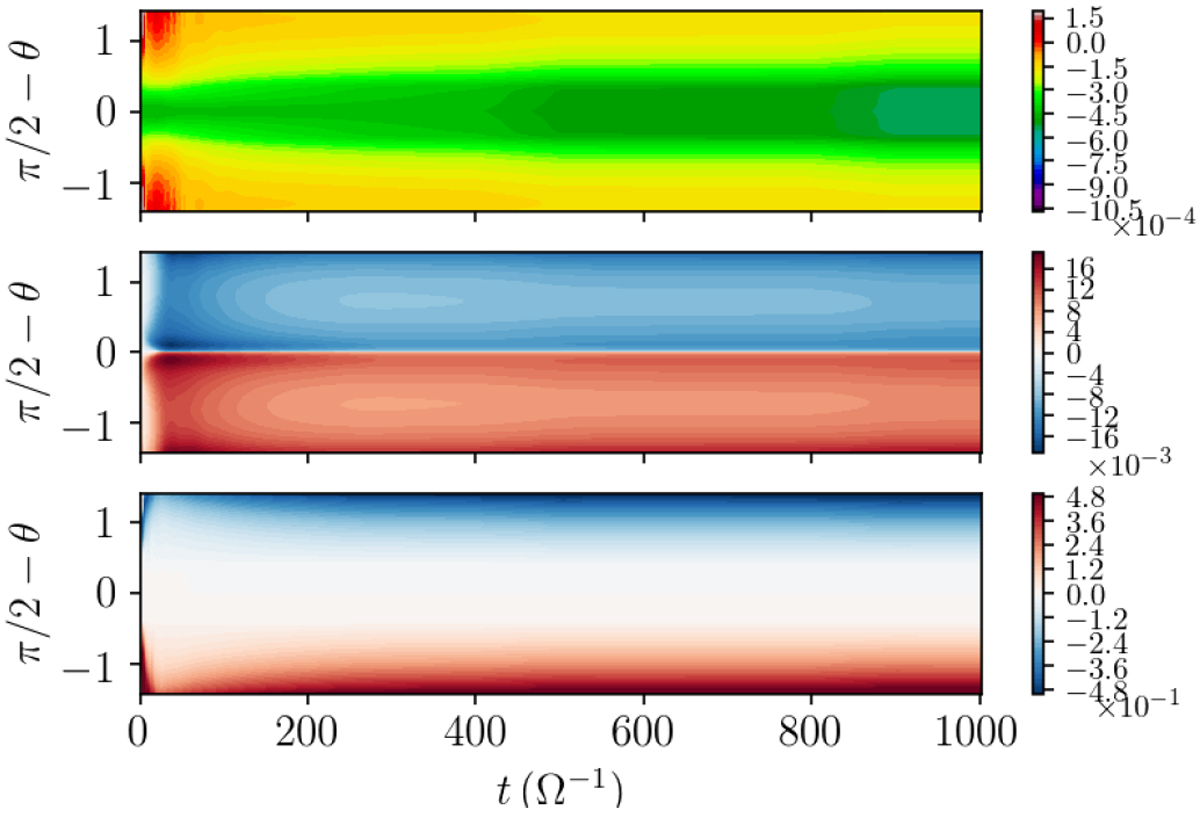
Space-time diagram showing the evolution for the first 1000 Ω−1 of Bθ (top), Bφ (middle), and vθ (bottom) for the fiducial run. The system quickly reaches steady state. In order to continue the solution as a function of the field strength, the field is slowly increased every 300 Ω−1.
Current usage metrics show cumulative count of Article Views (full-text article views including HTML views, PDF and ePub downloads, according to the available data) and Abstracts Views on Vision4Press platform.
Data correspond to usage on the plateform after 2015. The current usage metrics is available 48-96 hours after online publication and is updated daily on week days.
Initial download of the metrics may take a while.