Fig. 21.
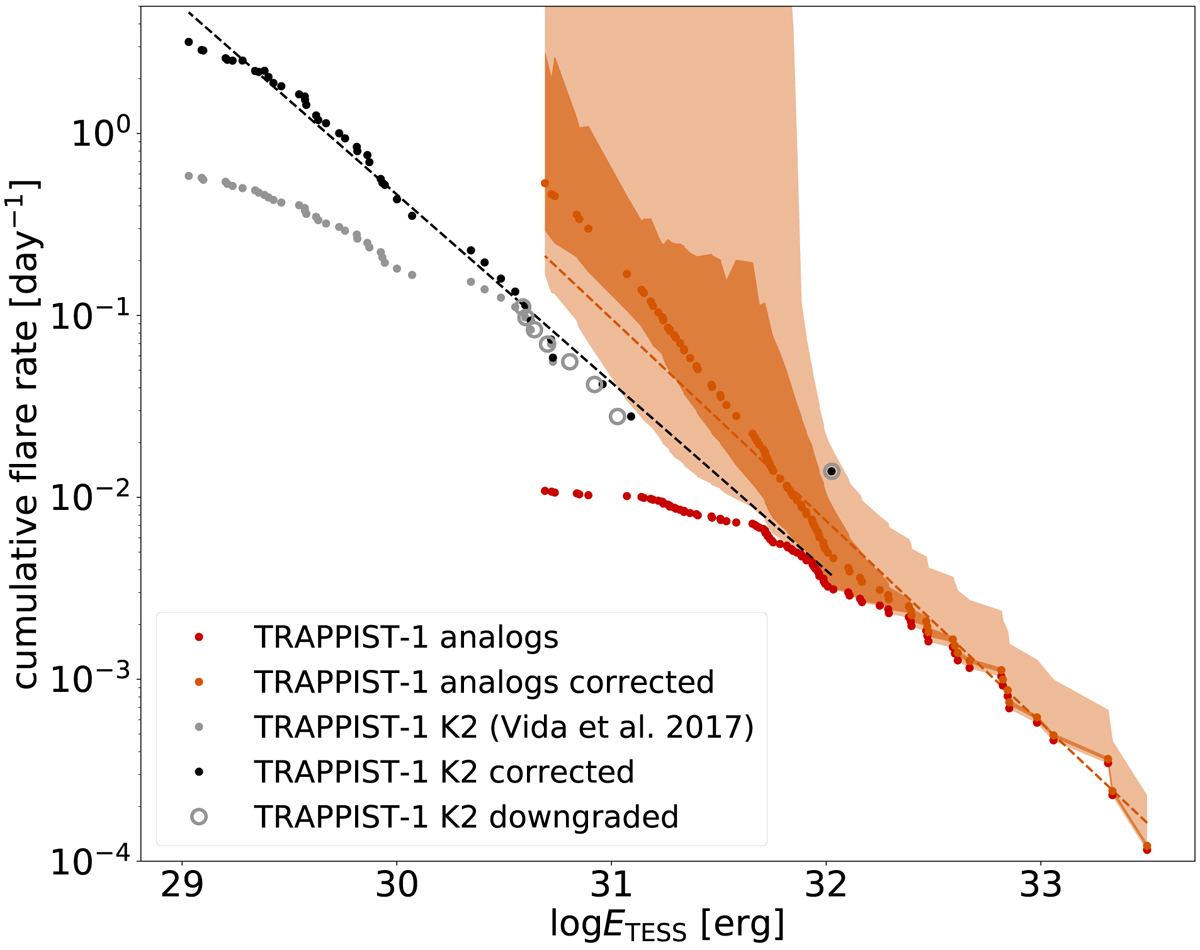
Composite FFD for the whole sample. Red points are the original values, orange points are corrected for flare recovery rate (orange line in Fig. 13), and shaded regions are the 1 and 2σ confidence intervals. The FFD of TRAPPIST–1 with K2 short cadence data from Vida et al. (2017) is also plotted for reference, converted to the TESS bandpass, and also its correction for completeness. Grey circles shows the flares recovered from the K2 light curve of TRAPPIST–1 downgraded to imitate a hypothetical TESS observation (with added noise, and re-sampled to 30-min cadence). Dashed lines show linear fits.
Current usage metrics show cumulative count of Article Views (full-text article views including HTML views, PDF and ePub downloads, according to the available data) and Abstracts Views on Vision4Press platform.
Data correspond to usage on the plateform after 2015. The current usage metrics is available 48-96 hours after online publication and is updated daily on week days.
Initial download of the metrics may take a while.