Fig. 10.
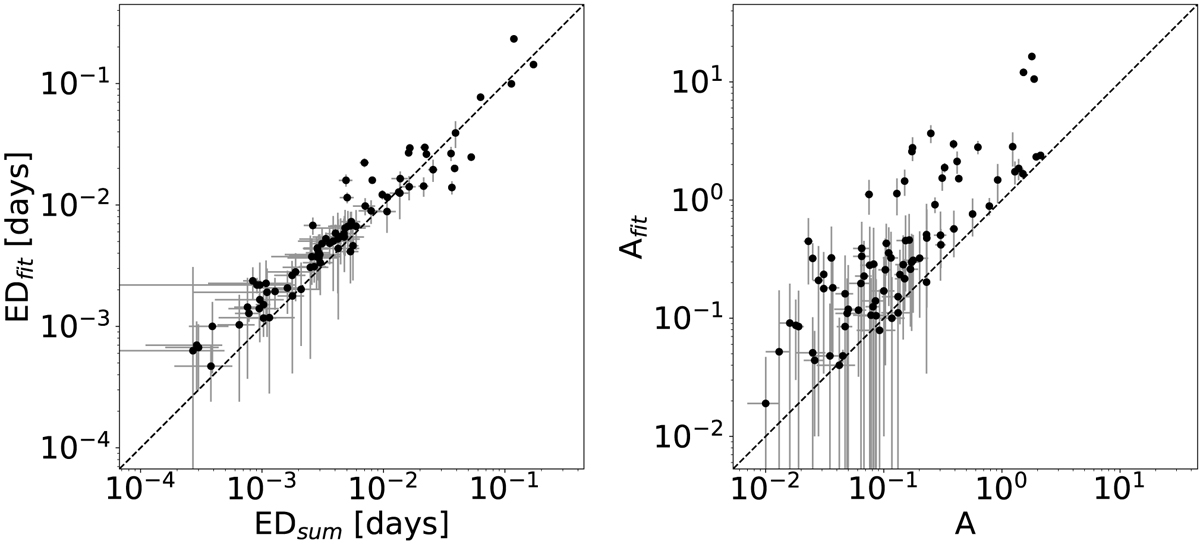
Flare parameters from different methods. Left: comparison of the summed and fitted EDs. While they generally give the same result, they can differ by a factor of 2–3. Right: comparison of the observed flare amplitude (the highest flux value) and the fitted amplitude. Owing to the low time resolution, the observed peak is generally smaller.
Current usage metrics show cumulative count of Article Views (full-text article views including HTML views, PDF and ePub downloads, according to the available data) and Abstracts Views on Vision4Press platform.
Data correspond to usage on the plateform after 2015. The current usage metrics is available 48-96 hours after online publication and is updated daily on week days.
Initial download of the metrics may take a while.