Fig. 1.
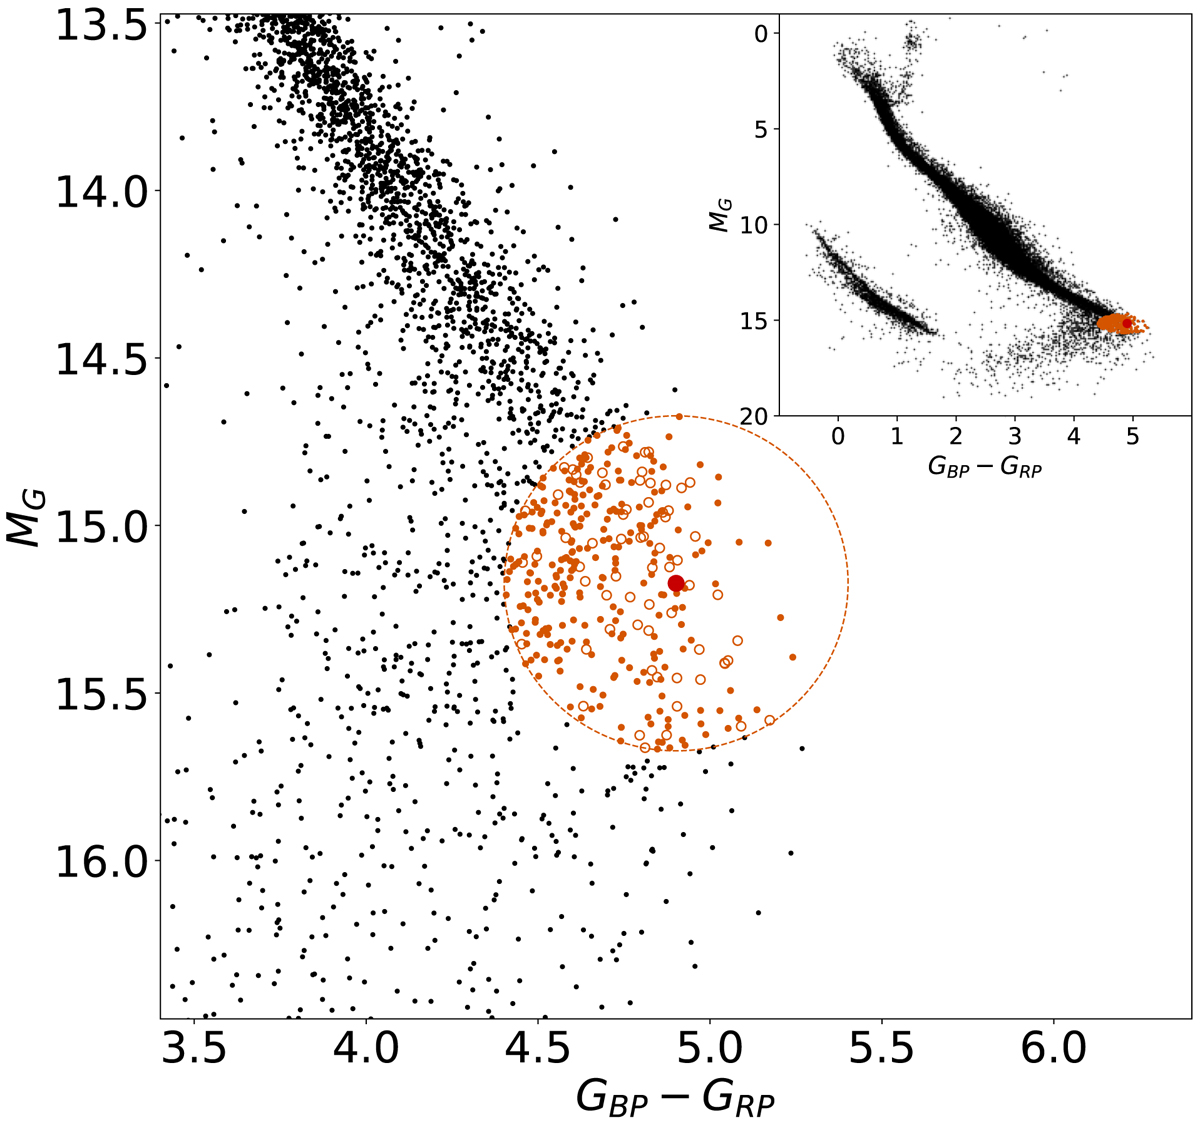
Selection criteria on the Gaia color–magnitude diagram. The red point shows the position of TRAPPIST–1 and the orange points represent the final TRAPPIST–1 analog sample. The empty orange circles indicate stars that were not initially included as a result of the Gaia quality cuts, but were later added from existing UCD catalogs.
Current usage metrics show cumulative count of Article Views (full-text article views including HTML views, PDF and ePub downloads, according to the available data) and Abstracts Views on Vision4Press platform.
Data correspond to usage on the plateform after 2015. The current usage metrics is available 48-96 hours after online publication and is updated daily on week days.
Initial download of the metrics may take a while.