Free Access
Fig. 8
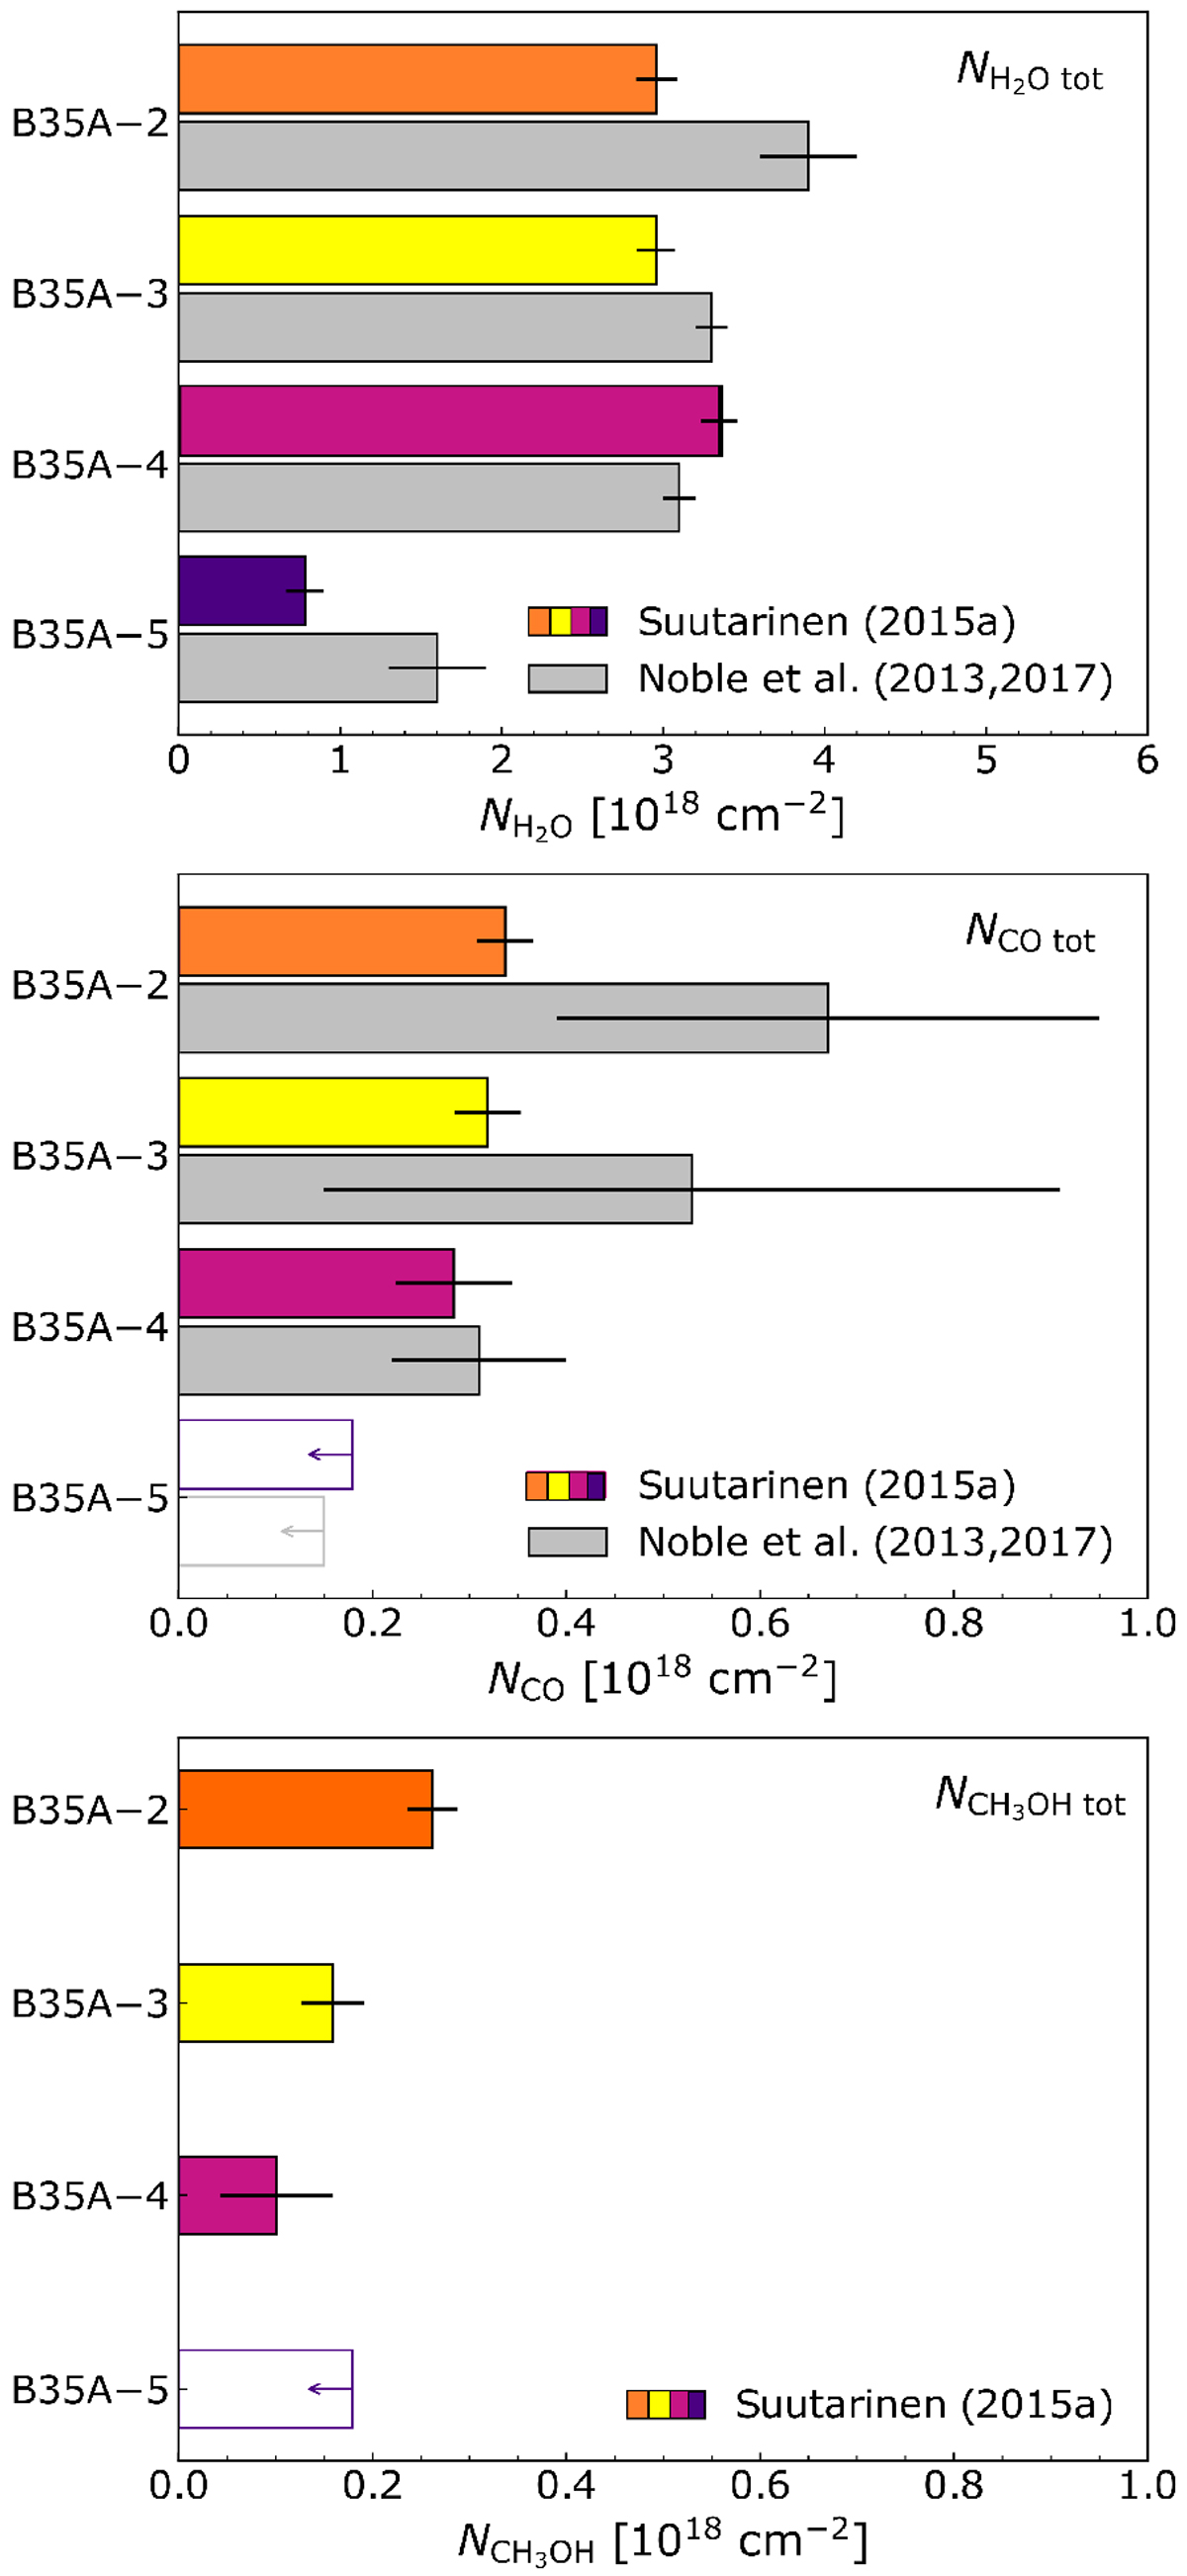
H2O (top), CO (middle), and CH3OH (bottom) total ice column densities obtained in Suutarinen (2015, the sources are colour-coded) compared to Noble et al. (2017, light grey). The empty bars represent upper limits on the column densities.
Current usage metrics show cumulative count of Article Views (full-text article views including HTML views, PDF and ePub downloads, according to the available data) and Abstracts Views on Vision4Press platform.
Data correspond to usage on the plateform after 2015. The current usage metrics is available 48-96 hours after online publication and is updated daily on week days.
Initial download of the metrics may take a while.