Fig. 6
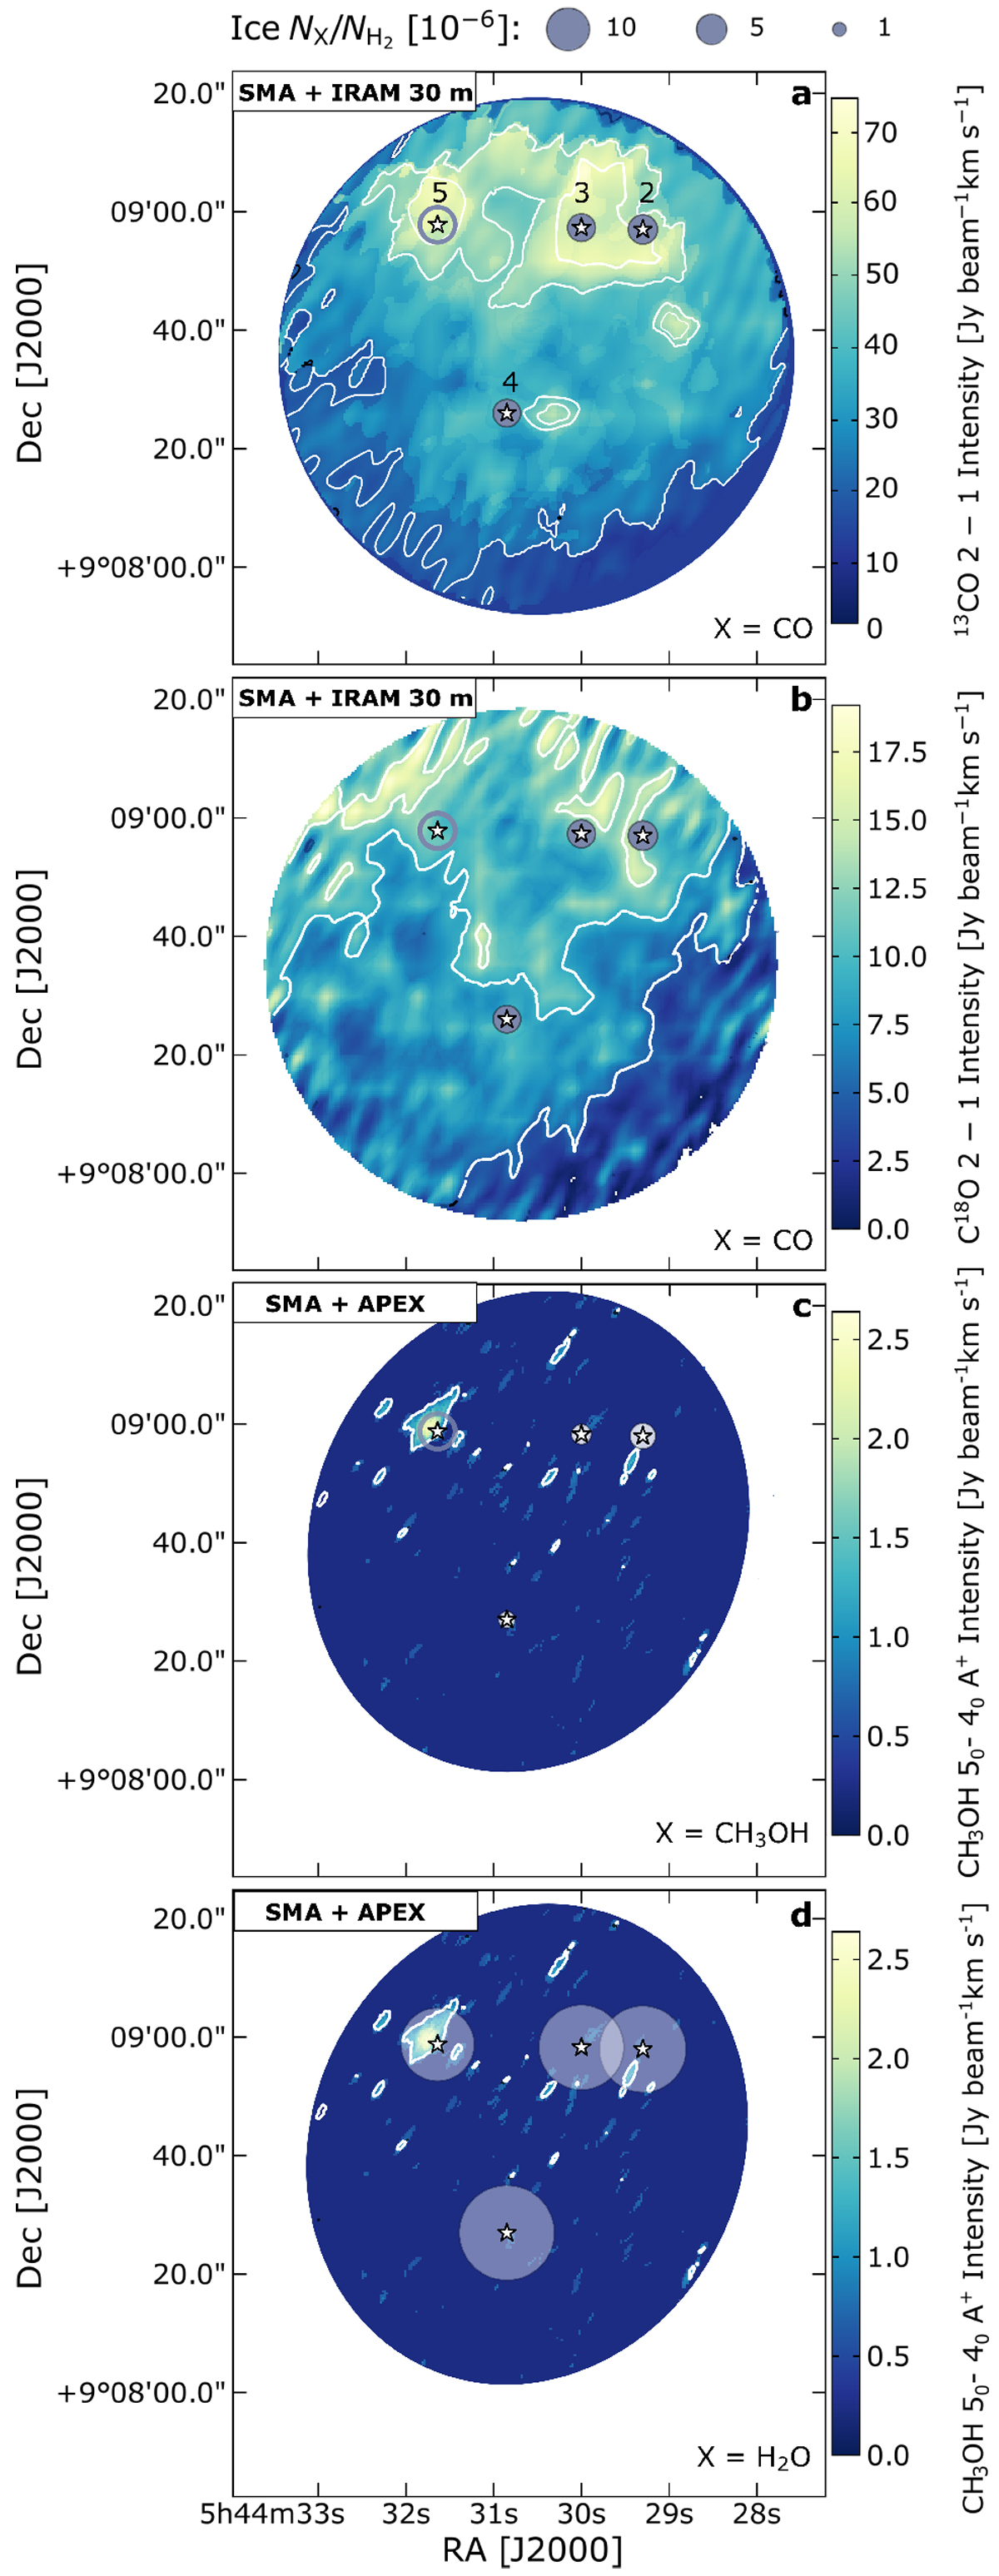
Gas-ice maps of B35A. Ice abundances are indicated as filled grey (panels a and b) or white circles (panels c and d), and upper limits are displayed as empty circles. Contour levels are 5, 10, and 15σ. a: CO ice abundances on gas 13CO 2−1. b: CO ice abundances on gas C18O 2−1. c: CH3OH ice abundances on gas CH3OH 50−40 A+. d: H2O ice abundances on gas CH3OH 50−40 A+. The white area outlines the primary beam of the SMA observations. The white stars mark the positions of the targeted B35A sources.
Current usage metrics show cumulative count of Article Views (full-text article views including HTML views, PDF and ePub downloads, according to the available data) and Abstracts Views on Vision4Press platform.
Data correspond to usage on the plateform after 2015. The current usage metrics is available 48-96 hours after online publication and is updated daily on week days.
Initial download of the metrics may take a while.